

- By Alan Bryant
- Continuous & Batch Processing
- Features
Summary
Using CO2 in enhanced oil recovery is an important component of carbon capture, utilization and storage projects for greenhouse gas reduction.

At the same time, many industrial processes emit greenhouse gases including CO2, methane, and volatile organic compounds (VOCs), so over the next several decades, many projects are planned to reduce emissions by capturing carbon from these processes or directly from the atmosphere and transporting CO2 to locations where it can be utilized or sequestered.
That means the carbon intensity of oil, gas, and fuels can be reduced by capturing and sequestering the carbon dioxide associated with their production. The amount of CO2 sequestered is deducted from the carbon impact of manufacturing and using those products. Complex accounting systems keep track of the amount of CO2 sequestered and credited to products, while automation systems capture the data required for monitoring, verifying, and reporting the stored volumes of CO2 along with the associated carbon crediting.
Enhanced oil recovery
Enhanced oil recovery fields historically use CO2 produced from naturally occurring reservoirs. However, capturing CO2 from industrial processes is becoming economically viable with recent incentives and provides environmental co-benefits. Significant infrastructure is in place for delivering CO2 to producing fields. Of the possible storage and utilization opportunities (Figure 1), EOR is the most mature and readily available. 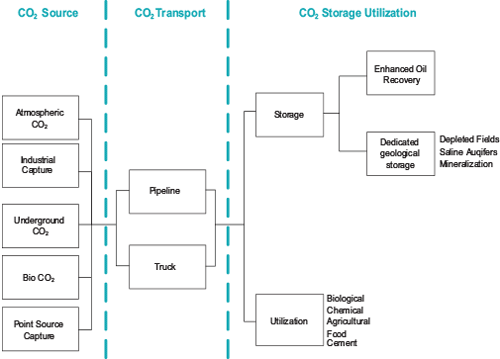
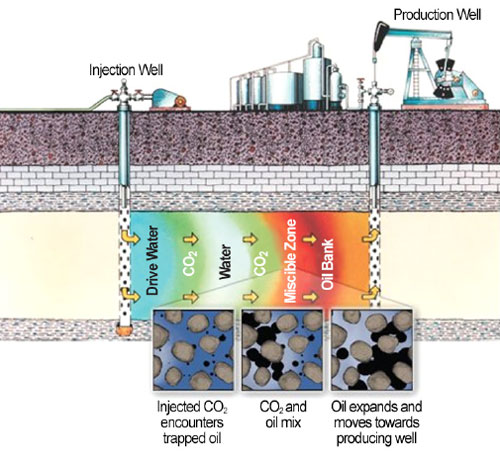
Supercritical CO2 injected into a reservoir swells the hydrocarbon, because unlike water, it is miscible in the hydrocarbon phase at reservoir conditions. Then, the injected CO2 sweeps the hydrocarbon to the producing wells, producing more reserves, thereby increasing the field’s overall hydrocarbon recovery factor. The recovery factor is the percentage of hydrocarbon in place that can be recovered.
Later in the life of the CO2-EOR flood, a substantial amount of CO2 is produced with the incremental hydrocarbon. This CO2 is separated from the hydrocarbon phase and recycled back into the reservoir CARB CCS. Not only does this recycled CO2 reduce the amount of purchased CO2 required to maintain the flood, but the recycling can also promote additional trapping within the reservoir. Eventually, the CO2 replaces hydrocarbons in the pore space, resulting in long-term storage within the natural trap of the reservoir.
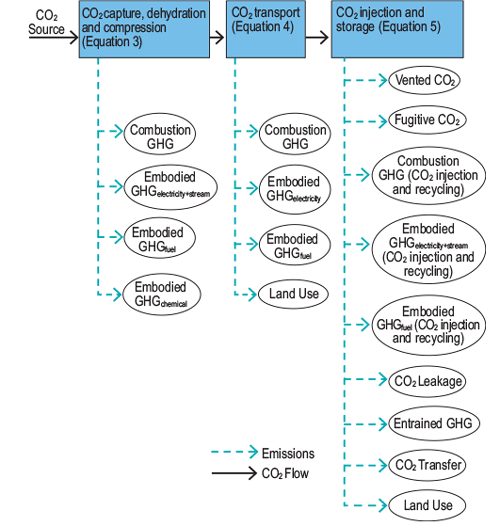
One example is from the California Air Resources Board (CARB) Carbon Capture and Sequestration (CCS) protocol. Other states and government agencies have similar guidelines or are in the process of developing them. The CARB CCS protocol applies to CCS projects that capture CO2 and sequester it onshore, in either saline or depleted oil and gas reservoirs, or oil and gas reservoirs used for CO2-EOR. The system boundary for CO2 capture and sequestration in oil and gas reservoirs is shown in Figure 3. The CCS Protocol applies to both new and existing CCS projects.
California’s Low Carbon Fuel Standard (LCFS) is designed to encourage the use of cleaner low-carbon transportation fuels in California. The LCFS standards are expressed in terms of the “carbon intensity” (CI) of gasoline and diesel fuel and their respective substitutes. The program is based on the principle that each fuel has life cycle greenhouse gas emissions that include CO2, CH4, N2O, and other GHG contributors. This life cycle assessment is used to account for the GHG emissions associated with the production, transportation, and use of a given fuel. The life cycle assessment includes direct emissions associated with producing, transporting, and using the fuels, as well as significant indirect effects on GHG emissions, such as changes in land use for some biofuels.
The carbon intensity scores assessed for each fuel are compared to a declining CI benchmark for each year. Low carbon fuels below the benchmark generate credits, while fuels above the CI benchmark generate deficits. Credits and deficits are denominated in metric tons of GHG emissions. Providers of transportation fuels must demonstrate that the mix of fuels they supply for use in California meets the LCFS carbon intensity standards, or benchmarks, for each annual compliance period. A deficit generator meets its compliance obligation by ensuring that the credits it earns or otherwise acquires from another party is equal to, or greater than, the deficits it has incurred.
Data collection occurs via the SCADA system throughout the CCUS process (Figure 4). In a typical EOR application, the process follows these steps:
1. CO2 is sourced from direct air capture, and capture from industrial processes.
2. CO2 is cleaned to pipeline specifications and compressed to supercritical phase.
3. CO2 is transported, typically by pipeline, to EOR fields. CO2 is typically transported and injected in supercritical phase.
4. CO2 from the pipeline is mixed with CO2 produced in the field and injected into the reservoir.
5. Produced gas is separated from oil and water, CO2 is processed, compressed, and recycled to the injection system.
6. Custody transfer meters measure the amount of gas delivered from the source to the pipeline, the pipeline to the field, and the amount recycled.
7. Flow measurements are delivered to the carbon accounting system, usually via the various SCADA systems. The data can be collected and organized in a data historian for transfer to the carbon accounting system which is doing the carbon intensity calculations.
8. The custody meter from the pipeline to the EOR field is a measure of the amount of CO2 sequestered.
9. The custody meters from each source to the pipeline are used to allocate the sequestered CO2 mass to each source. 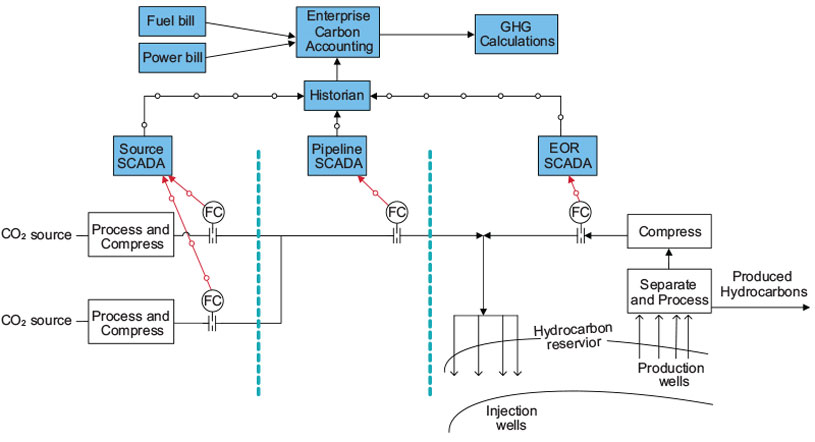
Energy is required at each stage, contributing to the GHG emissions of the sequestration process. Per the CARB protocol, the GHG reduction credited to the project is the difference between the amount of CO2 sequestered and the amount of GHG created in capturing, transporting, and injecting it (Equation A). 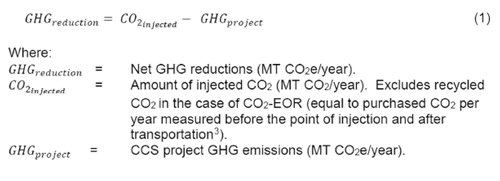
The CO2 from the pipeline is metered with a custody-quality flow element and flow computer. The CO2 injected that is credited to the project does not include the volume of recycled CO2 that gets injected.
The amount of sequestered CO2 can be allocated back to the sources if each source’s contribution to the pipeline is metered. The CI reduction attributed to each source is calculated from the total GHG reduction of the project and the ratio of that source’s contribution to the sequestered amount.
The GHG from operating the project includes GHG emissions from fuel combustion, electricity use, and chemical use (Equation B). Each of these must be measured and recorded at each stage. 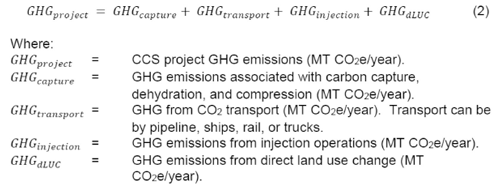
In many cases, the production facilities and injection facilities share the same utility power source. The metered power for the site must be segregated into production and injection power. If the site has a smart MCC or protective relays, the measured energy data can be read directly by the local automation system. If there are not smart devices, current transformers can be used to measure power loads for the injection-related equipment, or the loads can be estimated.
In the example in Figure 5, the total power delivered to the field comes from the utility bill. The amount of power used for CO2 injection is measured from the smart MCC and motor protective relays, collected by SCADA, and delivered to the data historian. The accounting system can then allocate energy used for injection and attribute the appropriate amount of GHG to the CO2-EOR process. 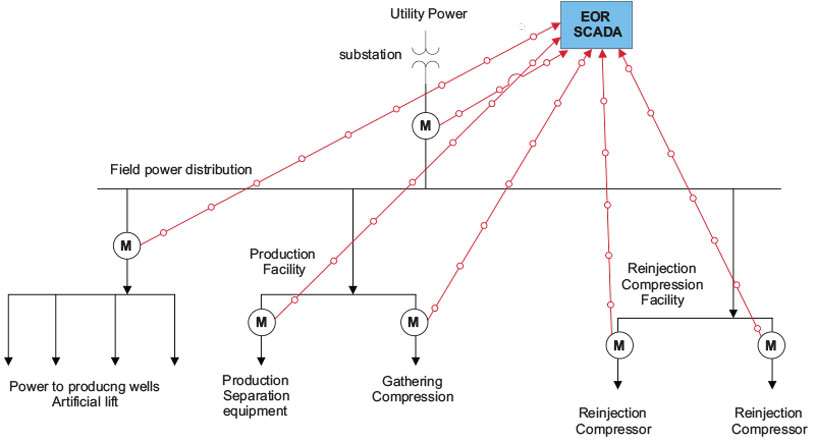
Data from various sources are consolidated into an enterprise system for accounting:
- Metered contribution of each source to the transportation system
- Total amount delivered by the pipeline to the project
- Total amount injected
- Measured power, fuel, and chemical use
- Utility power bills
- Fuel gas invoices
- Chemical invoices
Measured data from the sites might already be delivered via the existing SCADA infrastructure, so it would only require some database work to get it to the system.
A method to verify each input to the system is required. A backup plan for missing data must also be in place in case of instrument or communication failure. An example is shown in Figure 6. 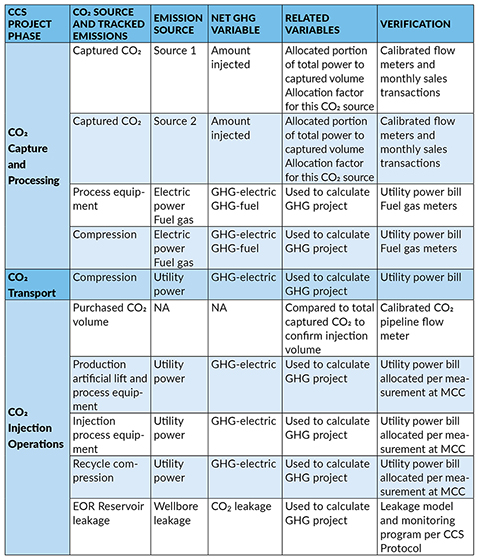
Final thoughts
To measure the amount of GHG reduction accomplished with sequestration in CO2-EOR, data must be consolidated from multiple sources, including power utility and fuel gas invoices, source control systems, transportation, and production SCADA. In many cases, the data are already available, but it is spread across multiple systems that must be integrated. The automation team’s role is to identify the necessary data in the SCADA and electrical systems, then make it available to the enterprise, perhaps via the data historian.
Photos courtesy of Occidental
Important Definitions
Greenhouse gas (GHG) emissions reduction can be accomplished by lowering the carbon intensity of fuels, e.g., adding carbon capture to ethanol production.
Carbon dioxide equivalent or CO2 equivalent (CO2e) converts the impact of known GHG emissions to an equivalent amount of carbon dioxide emissions in metric tonnes using the known GHG’s potential for global warming evaluated over the same period in the atmosphere, e.g., 100 years.
Carbon intensity (CI) is the measure of greenhouse gas emissions associated with producing and consuming a transportation fuel, measured in grams of carbon dioxide equivalent per megajoule of energy (gCO2e/MJ).
Carbon capture and sequestration (CCS) means the process of concentrating CO2 present in flue gas, exhaust gas, or air via chemical and/or physical separation methods, transporting the CO2 to an injection site, and injecting and sequestering the captured CO2 underground.
CO2 Enhanced Oil Recovery (CO2-EOR) means the injection into and storage of CO2 in conventional hydrocarbon reservoirs contributing to the extraction of hydrocarbon reserves.
Scope 1 emissions are direct greenhouse (GHG) emissions that occur from sources that are controlled or owned by an organization (e.g., emissions associated with fuel combustion in boilers, furnaces, vehicles).
Scope 2 emissions are indirect GHG emissions associated with the purchase of electricity, steam, heat, or cooling. Although Scope 2 emissions physically occur at the facility where they are generated, they are accounted for in an organization’s GHG inventory because they are a result of the organization’s energy use.
Scope 3 emissions are the result of activities from assets not owned or controlled by the reporting organization, but that the organization indirectly impacts in its value chain. Scope 3 emissions for one organization are the Scope 1 and 2 emissions of another organization.
Further Reading
Enhanced Oil Recovery, from U.S. Department of Energy
Carbon Capture and Sequestration Protocol Under the Low Carbon Fuel Standard, from the California Air Resources Board
LCFS Pathway Certified Carbon Intensities, California Air Resources Board
“Can This Carbon Capture Technology Help Create Negative Emissions?” from Forbes
Reader Feedback
We want to hear from you! Please send us your comments and questions about this topic to InTechmagazine@isa.org.