

- By Paul Gruhn
- March 31, 2020
- InTech
Summary
Fast Forward
- Functional safety engineers who follow ISA/IEC 61511 perform calculations based on random hardware failures.
- Accidents are typically the result of steady and slow normalization of deviation, or drift.
- Using Bayes’ theorem, prior belief can be updated even with subjective information.
ISA/IEC 61511 is more than statistical calculations

By Paul Gruhn, PE, CFSE
Functional safety engineers follow the ISA/IEC 61511 standard and perform calculations based on random hardware failures. These result in very low failure probabilities, which are then combined with similarly low failure probabilities for other safety layers, to show that the overall probability of an accident is extremely low (e.g., 1E-5/yr). Unfortunately, such numbers are based on frequentist assumptions and cannot be proven.
However, looking at actual accidents caused by control and safety system failures shows that accidents are not caused by random hardware failures. Accidents are typically the result of steady and slow normalization of deviation (a.k.a. drift). Although it is up to management to control these factors, Bayes’ theorem can be used to update our prior belief (the initial calculated failure probability) based on observing other evidence—such as the effectiveness of the facility’s process safety management process. The results can be dramatic.
Statistics
Some statistics are easy. For example, what is the probability of a fair six-sided die rolling a three? That should not challenge anyone. The answer is based on frequentist principles and can be proven by testing or sampling.
Some seemingly simple statistical examples are not as simple as they first appear. For example, imagine there is a one-in-a-thousand chance of having a specific heart disease. There is a test to detect this disease. The test is 100 percent accurate for people who have the disease, and 95 percent accurate for those who do not. This means that 5 percent of people who do not have the disease will be incorrectly diagnosed as having it. If a randomly selected person tests positive, what is the probability that the person actually has the disease? (Stop and answer the question before proceeding. I’ll talk more about it later.)
Some statistical cases are not simple at all. For example, what is the probability of your plant having a catastrophic process safety accident within the next year? You and others might have designed and calculated the risk to be as safe as driving a car (i.e., 1/10,000 per year), but how can you prove it? Frequentist-based statistics cannot be used to confirm or justify very rare events. Do you believe your plant is safer (or less safe) than any another facility you may have visited? Might there be variables, conditions, or precursors that you could observe that might affect your belief? And if so, might you be able to evaluate and quantify their impact on risk?
The answer is “yes.” And the answer for the heart disease example above is 2 percent. (See the box at the end of this article for the solution if you did not get the correct result.)
Bayes basics: Updating prior beliefs
Past performance is not an indicator of future performance, especially for rare events. Past performance would not have indicated (at least not to those involved at the time) what would happen at Bhopal, Texas City, or any other accident site you can think of. How many managers have you heard say, “We’ve been running this way for 15 years without an accident; we are safe!”
What if you were to calculate the probability of dying in a vehicle accident? In the U.S. there are about 35,000 traffic deaths every year. Considering our population, that works out to a probability of about 1/10,000 per year. You are obviously not going to live to be 10,000 years old, so the probability of your dying in a car crash is relatively low. Yet, might there be factors that influence this number, ones that you might be able to observe and control?
Consider the following: A salesman you know—but have never met—picks you up at your office and drives you both out for lunch. What probability would you assign to being in a fatal accident? On the way to the restaurant you notice him texting while driving, speeding, and being a bit reckless. You are a bit distressed, but you know you do not have far to go, and you keep your mouth shut. At your one-hour lunch you see him consume three alcoholic beverages.
Assuming you would even be willing to get back in the car at that point (there is always Uber), what probability would you assign to being in a fatal accident now? (Records have shown that alcohol is involved in 40 percent of traffic fatalities, speeding 30 percent, and reckless driving 33 percent. You are 23 times more likely to crash while texting. Seatbelts reduce the risk of death by 45 percent.) This is an example of updating a prior belief based on new (even subjective) information. That is Bayes’ theorem.
So one can observe conditions and make even subjective updates to previous predictions. People do this all the time. Even insurance companies do this when setting premiums (as premiums are not simply based on past performance).
A real example: Bhopal
Bhopal was the worst industrial disaster of all time. The facility was designed and build in the 1970s, and the accident took place in 1984. Although this was a decade before layer of protection analysis (LOPA) was introduced, this technique is useful for evaluating the original design and comparing it to the operation on the day of the event. This is not an attempt to explain why the event happened, nor should this be considered an example of 20/20 hindsight. This is simply an attempt to show how Bayes’ theorem might be used in the process industry.
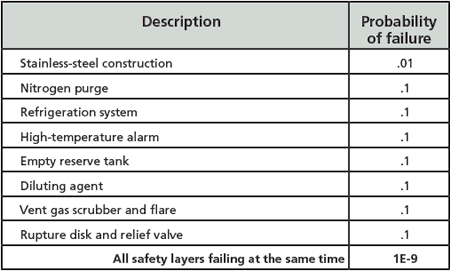
The facility in Bhopal was patterned after a successful and safe plant in the U.S. There were multiple independent protection layers to prevent the escalation of an event caused by the possible introduction of water into a storage tank. These are listed in table 1, along with sample probabilities for their failure.
Considering an initiating event frequency of perhaps 0.1/yr (a common number used in LOPA for many initiating events), the risk associated with this event would appear to be much lower than the risk of driving a car. Yet how could this be proven?
In reality, none of the layers were effective at Bhopal, and the accident happened within the first five years of operation (i.e., within the assumed time period of practically any single initiating event). All the layers at Bhopal did not magically fail at the same time. Trevor Kletz was well known for saying, “All accidents are due to bad management.” Ineffective management allowed all the layers to degrade (and there were common causes between many of them) to the point where none of them were available the day the event happened.
Such normalization of deviation, or drift, was not unique to Bhopal. This is a serious issue that affects many facilities even today. How might we be able to model this?
Functional safety and math
Functional safety engineers focus on the ISA/IEC 61511 standard. Following the life cycle of the standard involves determining a performance requirement for each safety instrumented function (SIF) and evaluating that the intended hardware design meets the performance requirements (and changing the design if it does not). This entails performing calculations considering the device configuration, failure rate, failure mode, diagnostic coverage, proof test interval, and much more. Yet the calculations only involve random hardware failures, and the numbers are often so low that they cannot be proven by frequentist statistics and sampling. The standard does discuss systematic failures (e.g., human errors of specification, design, operation), but not in a quantitative manner.
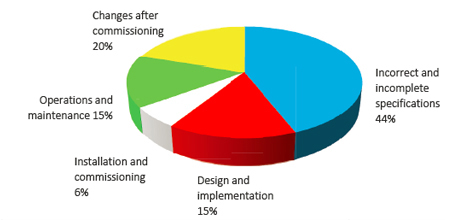
What really causes accidents involving control and safety systems? Figure 1 is well-known to all functional safety practitioners. (The results were published by the United Kingdom Health and Safety Executive more than 20 years ago, and it is unlikely that any of the values have changed since.) Few, if any, accidents have been due to a random hardware failure, yet that is what everyone is focusing on in their calculations. How might we include the management-related issues shown in figure 1 in our overall modeling? And if we were to do so, how much might it change our answer?
When deciding exactly what is a safe plant, some say, “One that has not had an accident.” As discussed earlier, such thinking is flawed. Similarly, what is the definition of a safe driver? One who has not had an accident? If the salesman driver mentioned earlier tried to reassure you by saying that he drives that way all the time and he has never had an accident, would you be reassured? It should be obvious to everyone that a safe driver is one who follows the rules and laws, does not drive under the influence of alcohol or drugs, is not distracted by texting, wears a safety belt, keeps the car in good condition, etc.
Yet does doing so guarantee there will not be an accident? Obviously not, but it does lower the probability. The same applies to a safe plant. And we can model this!
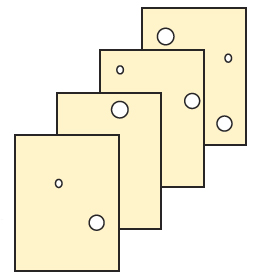
Swiss cheese model
James Reason came up with the swiss cheese model in the late 1990s (figure 2). It is a graphical representation of protection and mitigation layers. The effectiveness of each layer is represented by the size and number of holes in each layer. The holes are controlled by management; the more effective the management, the few and smaller the holes. Accidents happen when the holes line up, and a single event can proceed through each layer.
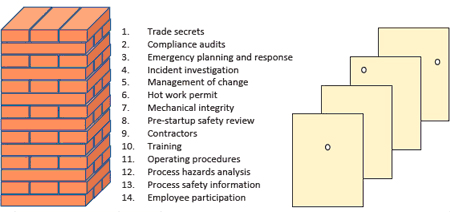
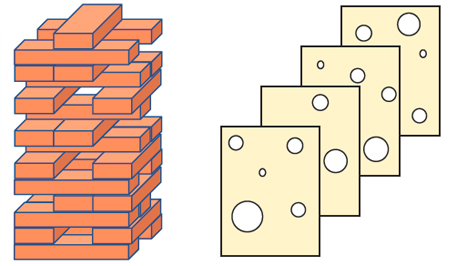
A similar concept can be represented graphically by comparing the 14 elements of the Occupational Safety and Health Administration (OSHA) process safety management (PSM) regulation to a Jenga tower (figure 3). Think of the 14 main elements as layers, and the subelements as individual pieces within each layer. An effective implementation of all the clauses in the regulation is similar to a complete Jenga tower, or a swiss cheese model with very few holes—and small ones at that.
But how many people working in process plants truly believe their facility has all the pieces in place, and that they are all 100 percent effective? Perhaps your facility is more like the tower and swiss cheese model in figure 4.
What is deceptive is that the tower in figure 4 is still standing. Everyone then naturally assumes they must be OK. (“We’ve been operating this way for 15 years and have not had an accident yet; we must be safe.”) Yet anyone would realize the tower is not as strong or as resilient as the one in figure 3.
Langewiesche said, “Murphy’s law is wrong. Everything that can go wrong usually goes right, and then we draw the wrong conclusions.” Might we be able to evaluate the completeness of the tower, or the number of holes in the swiss cheese model, and determine the impact on safety? If you knew the various layers were imperfect, might you be able to update your “prior belief” based on newly acquired information, even if that information were subjective?
Bayesian networks
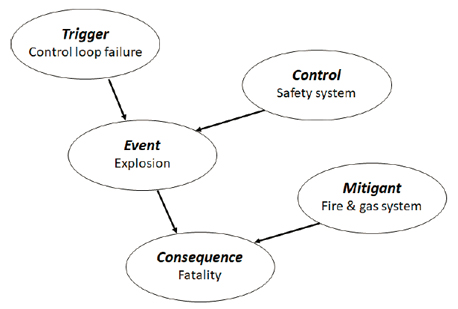
Functional safety practitioners will be familiar with fault trees and event trees. What might be new to many are Bayesian networks, a simple example of which is shown in figure 5. Just as with the other modeling techniques, there is math associated with how the network diagrams interact with each other. There are also commercial programs available to solve them automatically, as diagrams can get large and complex and the math too unwieldy to solve by hand. One interesting aspect of Bayesian networks is that the math and probability tables may be based on subjective ranking (e.g., low, medium, high).
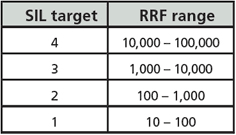
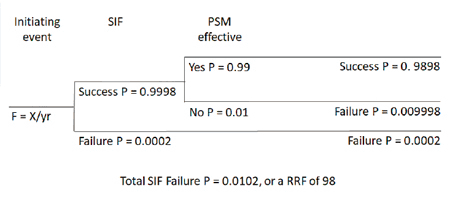
The case of interest here is to model the impact of the PSM program on the performance of a safety instrumented function (SIF). Imagine a SIF with a target of safety integrity level (SIL) 3. Imagine a fully fault-tolerant system (sensors, logic solver, and final elements) with a calculated probability of failure on demand of 0.0002. The reciprocal of this number is the risk reduction factor (RRF = 5,000), which is in the SIL 3 range, as shown in table 2.
As noted earlier, the calculations are based on frequentist statistics and cannot be proven. But as cited in the examples above, our “prior estimate” could be updated with new information, even if it were subjective. This example can be represented in the simple Bayesian network shown in figure 6.
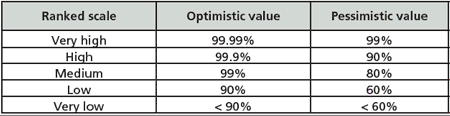
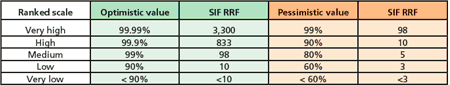
It is easiest to understand the solution of a Bayesian network if it can be shown graphically. This simple example can be solved with an event tree. All that is left for us to decide is what numerical values to assign to the ranking scales for the possible effectiveness of the overall PSM program. Admittedly there are many factors that could be evaluated here (e.g., competency, staffing levels, completeness of procedures, effectiveness of management of change, effectiveness of testing). The example here will simply group all these factors together. Two example ranges are shown in table 3. Before proceeding, do you think these values are reasonable?
The event tree using one value of PSM effectiveness (99 percent) is shown in figure 7, while table 4 lists the results for all the possible values.

The initial idealistic calculation (our prior belief) showed the risk reduction factor to be 5,000. Including another factor to update our belief results in a dramatic change to the number. Simply achieving SIL 2 may end up being very difficult in the real world. Admittedly, assigning numbers to the qualitative rankings of the PSM program will be a point of contention. Before showing these results to your subject-matter expert (SME) team members, ask them one simple question: What do they think is the overall effectiveness of the PSM program at their facility? Then show them the results.
In conclusion, being a safe driver is accomplished by following all the rules that are known to help avoid accidents. Similarly, operating a safe plant is accomplished by following all the rules and regulations effectively. Yet it is easy for functional safety engineers to focus instead on math and hardware calculations. The frequentist-based statistical calculations result in extremely small numbers that cannot be proven.
However, the prior belief probability can be updated with even subjective information. Doing so can change the answer by orders of magnitude. The key takeaway is that the focus of functional safety should be on effectively following all the steps in the ISA/IEC 61511 safety life cycle and the requirements of the OSHA PSM regulation, not the math (or certification of devices). Both documents were essentially written in blood through lessons learned the hard way by many organizations.
Reader Feedback
We want to hear from you! Please send us your comments and questions about this topic to InTechmagazine@isa.org.