Digitalization’s Influence on Maintenance Strategies
By Allison Buenemann
Process Automation
Summary
Building better models provides operations personnel with vast plant insights.
Leveraging algorithms and past performance, IIoT and analytics help determine schedules and increase uptime.
Historically, process manufacturers lacked sufficient data to predict critical equipment failures and instead relied on reactive maintenance to get plants back online quickly following failure. Prolonged periods of downtime piled up costs, exacerbated by extensive manual troubleshooting and root cause analysis.
Today, a significant increase in digitalization and Industrial Internet of Things (IIoT) implementations is expanding manufacturers’ access to equipment data, shifting the challenge from data availability to insight availability, and conversion of these insights into actionability. Process manufacturing companies are using advanced analytics solutions to gain insights from their data to predict equipment issues and inform optimized maintenance activities, leading to proactive maintenance programs, higher equipment reliability, and reduced maintenance and lost production costs.
Data-driven maintenance
Maintenance strategies have evolved as more data is measured, stored, and made available than ever before. This wealth of accessible data lets maintenance teams predict failures, calculate trigger points for condition-based maintenance, and share these insights with the personnel on the frontlines who are scheduling and executing the activities.
As data-driven strategies increasingly replace time-based maintenance, manufacturers are cutting operational expenditures previously dedicated to maintaining equipment on an arbitrary preventive maintenance (PM) schedule. This approach is coming merely decades after time-based PM replaced historic run-to-failure approaches, which forced companies to shoulder many costly unplanned outages.
With digitalization and IIoT implementations, manufacturers now have access to the data necessary for optimal equipment maintenance and reliability improvements, but the challenge has shifted to creating the right environment for analytics where contextual data can be viewed alongside process sensor data, and where time-series-specific calculations can be easily applied by process subject matter experts (SMEs). Advanced analytics software applications address this and other issues, empowering maintenance and reliability teams to uncover insights from many sources of information, informing actions based on predictive and prescriptive analytics.
Data analytics in context
“Analytics” is a broad-brush term used to describe any process that uses math to turn data into actionable information. It provides insights into consumer behaviors, marketing effectiveness, supply chain agility, financial performance, and other business functions. “Big data” analytics are necessary to deal with data in large volumes, velocities, and varieties, and there is no data of larger volume, greater velocity, or higher variance than those collected by sensors in process manufacturing.
A typical process plant stores time-series data from sensors measuring temperature, pressure, level, flow, vibration, and much more. A single refinery, for example, can possess hundreds of thousands of sensors with samples—timestamp and value pairs—recorded on intervals of hours, minutes, seconds, or even fractions of seconds. When dealing with large multinational companies, the number of sensors enterprise-wide can quickly approach a ten-digit figure. Performing analytics efficiently among these vast volumes of data quickly becomes paramount to unlocking the value hidden within.
But using advanced analytics applications to create meaningful insights from oceans of data has prerequisites. Big data is inherently complex, and it must be thoroughly understood and cleansed before it can be used in modeling and multivariate calculations. And of course, the adage “garbage in, garbage out” also applies, so process manufacturers must ensure the integrity of their data collection and storage systems before venturing anywhere near advanced analytics.
Once process manufacturers begin shopping around, they will notice nearly every software product, platform, and cloud service on the market claims to perform some sort of data analytics, with the type of analytics performed differing based on each tool’s intended functionality. The qualifier “advanced” typically refers to the use of statistics and machine learning innovations in analytics to assess and improve insights. “Augmented” analytics tap into the same innovation themes, while putting the analytics in the context of user business intelligence applications and other frequently used tools.
Decoding time-based analytics
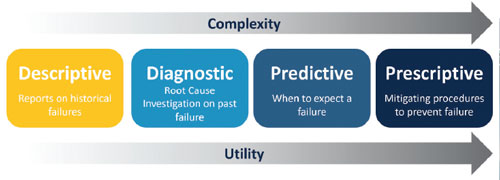
Under the umbrella of advanced analytics, there exists a hierarchy, beginning with retrospective functions—including “descriptive” summary statistics and “diagnostic” root cause investigations—and building up to futuristic flavors like “predictive,” which tells users when to act and “prescriptive,” which instructs them what to do (figure 1). These various types of increasingly complex—and useful—analytics work together, with the former two informing the latter two.
Figure 1. As analytic approaches progress from descriptive (retrospective) to prescriptive (proactive), they build on each other to increase in complexity and utility.
For example, retrospective analytics focus on historical degradation rates, the impacts of running different products or operating states, and the measurement of known failure modes. By contrast, futuristic—or proactive—analytics spotlight the likelihood of failures, prioritization of maintenance, and other mitigating measures to reduce risk. Embedding these four types of analytics into daily operation leads to greater organizational analytics sophistication, and this act typically delivers quick return on investment by optimizing maintenance schedules and minimizing unplanned outages.
Many process manufacturers already possess a strong foundation in descriptive and diagnostic analytics, which are key building blocks for aspirational predictive and prescriptive analytics. By leveraging these fundamentals, engineers and data scientists equip themselves for the deep dive into high-value predictive and prescriptive analytics.
When it comes to maintenance planning and scheduling, combinations of retrospective and forward-facing analytics are needed to reach an optimal state. Knowing when components failed in the past, how and why they failed, and what was happening in the time periods surrounding these failures are all critical pieces of information required to predict future failures and prescribe effective mitigating actions.
Informing condition-based maintenance
Condition-based maintenance (CBM) was the idyllic maintenance strategy of the Lean Six Sigma age. The premise of CBM is that an event, trigger, or exceedance drives maintenance, rather than a schedule. The challenge with CBM was never in defining the condition that prompted a maintenance activity, because these conditions are often predefined by ancillary equipment constraints, like a maximum allowable temperature or pressure, or a minimum flow requirement. Rather, the challenge was in determining which limit would be exceeded, and when.
CBM is much more valuable when combined with model construction, marrying monitoring and forecasting techniques that together make up predictive analytics. For example, using near-real-time vibration data to do CBM on a fleet of pumps requires setting conservative triggers to effectively avoid running to failure in the time it takes to schedule and perform maintenance activities following detection. The downside of a conservative trigger is the inevitable presence of occasional false positives.
By contrast, when past and current vibration data is leveraged using a model, the model can construct a vibration forecast and compare it with historical runs in relation to other process signals. This better-informed prediction can approximate not only when a trigger will be hit, but when the failure is likely to occur, providing the greatest possible lead time for maintenance. In addition, these predictions can actively adjust over time, informing and updating the urgency of service based on how operation continues.
Many manufacturers in the chemical and other process industries have transformed their operations by developing maintenance strategies built on the foundation of predictive analytics. As a result, these companies are minimizing downtime, unnecessary maintenance, and operational uncertainty, saving millions of dollars every year. The most successful predictive analytics applications often combine first principles models with statistical techniques to develop forecasts based on theory and behavior.
Filtration membrane predictive maintenance
When producing certain biopharmaceutical compounds, the desired molecules are separated from other species using membrane filtration systems. During each batch, particles build up on the membrane, and a clean-in-place (CIP) procedure must remove the accumulation between batches. Over time, these filtration membranes can degrade, causing CIP procedures to become less effective.
Engineers at a major bioprocessor suspected this was the case with one of their operations. Fearing unplanned downtime, they sought a way to identify long-term particle buildup on the permeate filter to predict when maintenance was required.
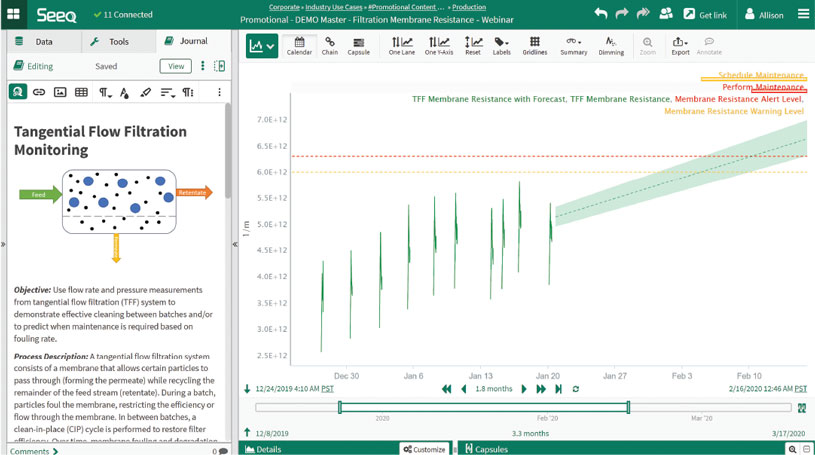
Using an advanced analytics application, the manufacturer calculated the filter membrane resistance based on pressure and flow sensor data, and on known values of surface and fluid viscosity, by applying Darcy’s Law. This reduced the variables of interest, providing clear visual indicators of degrading membrane performance, confirming the engineers’ suspicions (figure 2). Figure 2. Data from multiple filtration membrane sensors was dimensionally reduced to establish a membrane resistance soft sensor in the advanced analytics application. The soft sensor was regressed and projected into the future to determine the appropriate maintenance date.
The team applied a linear regression algorithm to the data, effectively modeling the filtration degradation rate. This model was extrapolated into the future to build a predictive maintenance forecast and warning schedule, and maintenance activities are now proactively planned, maximizing the lifespan of filters and streamlining operations.
Catalyst end-of-run prediction
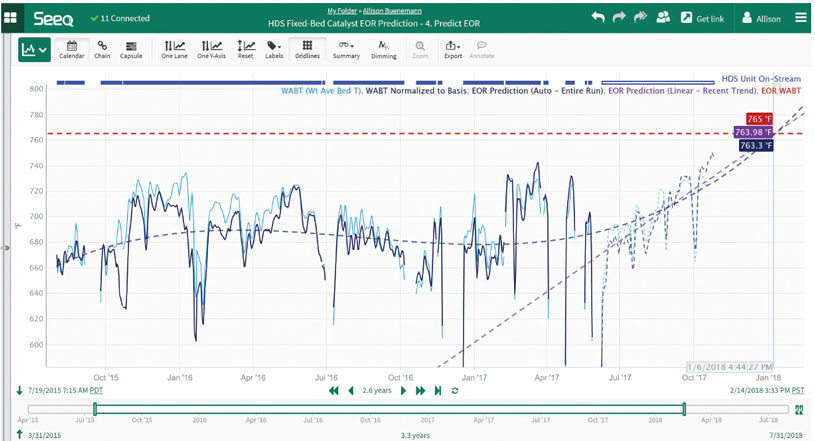
Degradation also occurs in the fixed bed catalysts used in hydrodesulfurization (HDS) units over time, requiring maintenance to avoid product quality issues that constrain allowable production rates. Engineers often use the weighted average bed temperature (WABT) as a key metric to determine catalyst bed health. However, other process variables—especially variable composition and flow rate—make it challenging to develop an accurate model of the WABT. For this reason, data scientists must cleanse and normalize calculated WABT values to create an acceptable data set for a regression model algorithm prior to plotting (figure 3). Figure 3. Using the advanced analytics application, SMEs compared WABT predictions from a full data set to a recent sample to determine maintenance requirements in the coming months.
To determine whether the degradation of the catalyst bed on an HDS unit had accelerated, engineers at a large downstream petrochemical company calculated and extrapolated multiple regression models to predict the required maintenance date. It became clear, after analysis, that the degradation rate had become more aggressive in recent months, and the HDS unit required an early catalyst change. Catching this issue early eliminated months of constrained-rate operation, saving the company more than $5 million in productivity losses.
Product run-length optimization
Fouling, catalyst degradation, and other process effects often constrain production rates throughout the course of a product run. This is frequently the case for polymer production processes where produced materials begin to coat the insides of vessels and pipes, restricting flow, building up pressure, and diminishing heat transfer. To remove such contaminants, manufacturers are forced to shut down and perform equipment maintenance, or execute online procedures, applying heat to coated equipment to melt off foulant layers.
A large polyethylene producer was experiencing production rate degradation due to the buildup of polymer skins on the walls of a tubular reactor, which restricted flow and increased the pressure delta, causing the process to approach the design limits of upstream equipment. The company sought a defouling strategy to increase production, prevent damage, and fulfill customer orders more quickly.
Using the advanced analytics application, a team of SMEs created a regression model of the degrading production rate to forecast when the production target would be met if no action were taken. They then compared this date to an alternative model incorporating multiple defouling procedures over the run. The team performed calculations to determine the optimal number of defoul cycles, minimizing the total time needed to produce a given order size.
Once the magic number was determined, the SMEs identified the appropriate minimum throughput rate trigger, and created a golden profile for the optimal number of future cycles between defouling procedures. This golden profile was formed from data collected during an optimal performance run, and it is used to continuously monitor and compare future runs as new data is recorded.
By deploying this model and performing analysis in the advanced analytics application environment, SMEs compared actual performance against the forecast to pinpoint the ideal times for executing defoul procedures. Implementing this model-based defouling strategy enabled a sold-out production unit to meet customer orders an average of 11 percent sooner over the course of the following year, empowering the company to grow market and profit share in its core markets.
Scaled predictive analytics enhance production
Just like in the academic lab, accurate predictions for process manufacturing operations depend on in-depth knowledge of past equipment behavior and outcomes. By using advanced analytics applications combining retrospective with proactive analytics, process experts and data analysts can easily build robust models capable of predicting plant maintenance needs and risk-mitigating procedures.
With collaboration among process, maintenance, and reliability experts, and with the right tools in their digitalization toolbox, process manufacturers can build better models and provide operations personnel with vast plant insights. Empowered with self-service analytics, staff can predict equipment issues well in advance of failure, helping optimize maintenance schedules and prevent costly downtime.
All images courtesy of Seeq
Reader Feedback
We want to hear from you! Please send us your comments and questions about this topic to InTechmagazine@isa.org.
Allison Buenemann is an industry principal at Seeq Corporation. She has a process engineering background with a BS in chemical engineering from Purdue University and an MBA from Louisiana State University. Buenemann has nearly a decade of experience working for and with chemical manufacturers to solve high-value business problems using time series data. As a senior analytics engineer with Seeq, she used her process engineering experience to aid in new customer acquisition, use case development, and enterprise adoption. In her current role, she enjoys monitoring the rapidly changing trends surrounding digital transformation in the chemical industry and translating them into product requirements for Seeq.