Optimizing related process variables to improve profitability
By Yasunori Kobayashi
InTech
Summary
Fast Forward
KPIs are often not aligned, producing suboptimal process plant performance.
Advanced process control metrics referred to as synaptic performance indicators can be used to align KPIs.
The result is improved performance, primarily driven by control room operators supplied with SPI information and suggested actions.
Profitable and reliable operation depends on optimizing related process variables, which can be achieved by control room operators leveraging DCS domain knowledge and big data
By Yasunori Kobayashi
In today's competitive environment, process industry companies are focused on two key objectives: profitability and delivering value to customers. However, these objectives are often disparate goals not aligned across departments, plants, or enterprise boundaries.
Disconnected, outdated methods of reporting and inconsistent metrics make it nearly impossible to get a holistic view of performance drivers. Information is often available only after the fact and lacks contextual knowledge, which leads to poor decision making.
To address these and other issues, many companies use C-level key performance indicators (KPIs), such as costs, margins, and incidents. Unfortunately, the KPIs used by C-level executives (CEOs, CFOs, etc.) frequently do not match up with those used by engineering and operations personnel. They typically have their own set of KPIs, often generated independently to maintain safe and stable plant operations.
Additionally, factors like integrity operating windows, plant constraints, and economic conditions can affect KPI prioritization and operations. Adding to these challenges, experience and competency are declining due to retirement of key personnel, especially control room operators. This situation can be addressed and rectified to some extent by using the big data stored in distributed control systems (DCSs) and plant historians to create better KPIs, but this requires careful analysis to produce the desired results.
What if KPIs could be structured systematically across an organization from management through engineering to operations to unify all the employees' capabilities, motivate them to do better, and cultivate the knowledge that is in the DNA of the organization? This can be done, but it requires alignment of KPIs among all plant personnel, starting with optimization of related process variables in operations.
Creating systematic SPIs
Domain knowledge and the big data found in the plant DCS can help process industry companies select, monitor, and optimize key process variables and set points for operations, such as fuel gas consumption, furnace efficiency, and main fractionator pressure. Given the right information, control room operators can accomplish these tasks by interacting with the DCS. Successful implementation will not only result in safe and stable operation, but also improve profitability, energy conservation, and asset reliability.
Process variables are optimized by setting an optimal range for each critical set point, which can be used to systematically structure a plant's KPIs and create an improved set of metrics, henceforth referred to as synaptic performance indicators (SPIs).
Process historians are electronic databases, typically used to store and display data. In a process plant, common data points include temperatures, flow rates, pressures, levels, and other types of analog data. Increasingly common is the "historization" of digital data, such as the output or feedback states associated with valves, pumps, and other discrete control devices.
Analysis of historical data by process engineers and experts with extensive domain knowledge can determine the correct range for each set point, a complex task because many control loops interact with each other. Further complexity is added by also considering the effects of set points on the supply chain. All this data can be combined to provide deep insight into the behavior of a process at any point in time. These insights can be used to optimize set points for improved operations.
SPIs for each area can be defined by using domain knowledge and historian information. SPIs help operators set an ideal range for each variable with an alerting function. They provide expert guidance in the form of messages when a variable goes outside of the ideal range. Other functions in a DCS can guide operators to optimize related process variables for more profitable and reliable production.
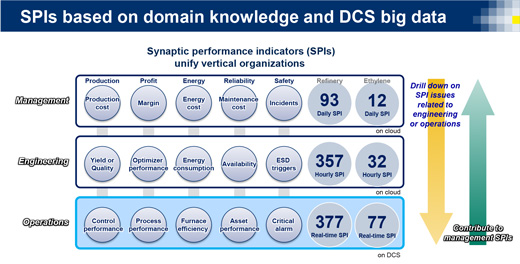
These key process variables are systematically connected to engineering and C-level KPIs, so C-level personnel can drill down on KPI issues related to engineering or operations. Operations can also contribute to C-level KPIs.
SPIs in action
At the operations level, a typical midsized refinery has about 377 SPIs, and a typical ethylene plant has about 77 SPIs. Approximately 60 percent of SPIs indirectly correspond to control variables, and 40 percent directly correspond to control variables. Our midsized refinery will have about 93 high-level SPIs for daily viewing and use by management, 357 SPIs for hourly viewing and use by engineering personnel, and 377 SPIs for real-time viewing and use by shift operators (figure 1).
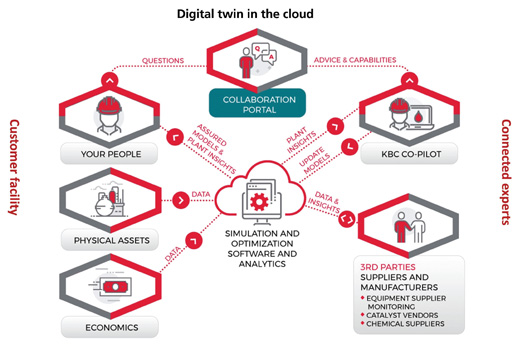
Some of the management and engineering SPIs use manufacturing execution system data as well as DCS data (e.g., production plan data, crude assay data, laboratory data), along with data from external sources, such as utility and feedstock pricing. Managers and engineers often prefer to check SPIs using a laptop, mobile phone, or tablet from anywhere in the world.
Therefore, management and engineering SPIs are often provided via a digital twin in the cloud (figure 2). The digital twin in the cloud gathers data from the plant's distributed control systems, historians, and labs-as well as from other sources, such as feedstock and energy pricing. It uses this data to calculate relevant management and engineering SPIs, and securely distributes this information to users worldwide.
On the other hand, operations SPIs, the main topic of this article, can be determined using DCS data. Each of the 377 operation SPIs has up to five subcategories in the areas of control performance, process performance, energy efficiency, asset performance, and critical alarms. For SPIs not measured due to a lack of sensors or analyzers, process simulation can be implemented within the DCS to calculate soft sensors for estimating unmeasured process variables from measured variables using rigorous process models.
Figure 1. The term synaptic performance indicator (SPI) identifies an improved set of key performance indicators that can be used to optimize plant operations. Figure 2. Digitally replicating live plant operating data and economic data in the cloud allows KBC, a division of Yokogawa, to distribute SPIs to management and engineering personnel worldwide.
Improve operations
Once the SPIs are created, they provide measurable goals for control room operators, typically tied to optimization strategies and production plans. Most of these goals are achieved not through the efforts of a single operator, but by the effort of all operators working in the facility, so tracking operator performance is difficult, but can be done by using karaoke-type dashboards.
In Japan, there is a mechanism for scoring karaoke singers based on categories, such as pitch, technique, passion, stability, and rhythm. These dashboards help singers analyze their singing and motivate them to improve.
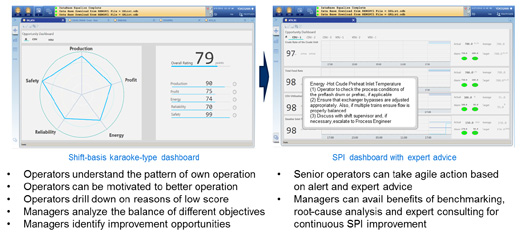
In process plants, karaoke-type dashboards use a similar scoring mechanism, but focus on operational priorities, such as production, profit, energy, reliability, and safety (figure 3). These dashboards help control room operators analyze operational priorities and find areas for improvement, motivating them to achieve improved operation.
Figure 3. Control room operators can use karaoke-type dashboards to improve plant production, profits, energy use, reliability, and safety (left side of diagram). Plant engineers and experts create SPI dashboards to guide operator actions and optimize SPIs (right side of diagram).
The karaoke-type dashboard tracks the performance of each control room operator during his or her shift by checking the uptime of an SPI (time during which the SPI is in the ideal range or without alarm). Operators can check their performance with respect to profit, production, safety, reliability, and energy use. Improvements can be visualized by improved performance of the operator during a shift.
Karaoke-type dashboards can be linked to relevant SPI dashboards that display each SPI with its ideal range(s). If a certain SPI is outside the ideal range, an alert is automatically activated, and expert advice is displayed so the control room operator can take agile action to optimize the SPI. By optimizing SPIs, operator actions mimic those of a multivariable controller, which is one of the categories of advanced process control, resulting in optimal control of related process variables.
Improve process plant engineering
SPIs, alert information, and operators' scores are stored in the DCS, and plant engineering and third-party personnel can use them for benchmarking, root-cause analysis, or expert consulting for continuous improvement. SPIs and related dashboards can thus help engineers and operators transform their work from event driven to profit driven.
Even with profit-driven operation, it is easy to fall into the trap of functional silos of information, with each person optimizing his or her area of responsibility to meet objectives-but with overall effectiveness of the organization, operation, or value stream suboptimal. This happens when the engineering team and management personnel use a set of SPIs that are different from and nonaligned with the control room operators' SPIs. This problem can be addressed by having aligned targets for engineering, operations, and management.
The control room operator SPIs are utilized to alarm the engineering team of possible improvement opportunities, and this creates aligned targets for the operations and engineering teams. The engineering team can use structured SPIs and stored data for analysis of plant performance, for improvement opportunities, and for analysis of other issues related to production.
Improve plant management and performance
SPIs for management give a clear picture of high-level performance metrics, such as facility operations, the difference between planned and actual production, and energy use. The balanced performance metrics associated with carefully crafted SPIs lead to improvements in quality and efficiency, reduce inventory, ensure compliance, and increase flexibility-ultimately leading to greater profitability.
SPIs are systematically and seamlessly connected from the management level to engineering personnel and then to control room operators, and vice versa. They help management to drill down to issues related to operations. Improvements in control room operator SPIs also ultimately contribute to better management SPIs.
Synaptic performance indicators aligned from operations to engineering to management provide a common mission for all plant personnel, leading to improved performance of the plant or facility.
Reader Feedback
We want to hear from you! Please send us your comments and questions about this topic to InTechmagazine@isa.org.
Yasunori Kobayashi, is the general manager and executive consultant at Yokogawa. He has 30 years of consulting experience in process automation, and over 10 years of management experience in R&D, marketing, sales, operations, and services. He has led projects developing new solutions, including procedural automation using AI (Exapilot), software sensors using Neural Networks (Exaneuro), real-time alarm browsers in DCS (CAMS), automation benchmarking (CEA), knowledge-based graphics using ergonomics (AOG), and remote monitoring and consulting using cloud technology (KBC Co-Pilot Program).