

- By Andrew Kinser, Marc L. Riveland
- Automation Basics
Summary
By Marc L. Riveland and Andrew Kinser
Depending on the methods ball valve manufacturers use to determine their published rated flow capacities, the resulting value may be different, even for virtually identical valves. Rated flow capacity of a valve is typically expressed in terms of some type of flow coefficient, currently usually, Cv and Kv. They are equivalent but differ in value due to the units for flow rate and pressure they are associated with. The ISA and IEC standards recognize both coefficients. Equations are written in terms of a generic coefficient, C, and units constants, N, that account for the specific coefficient and units. The preferred method of evaluating these coefficients is by conducting a flow test. Full-bore ball valves (FBBVs) in the full-open position present some challenges. First, they typically do not fall within the scope of conventional control valve sizing methods. One of the criteria imposed by these standards to maintain stated accuracy is that:
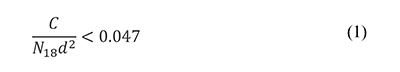
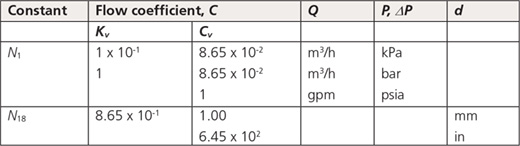
Where C = flow coefficient (Cv or Kv ); d = internal diameter; and N18 = units constant (table 1). Note that Cv is the resulted coefficient when using U.S. standard units, and Kv is the resulted coefficient when using metric units.
Values of this expression for typical published FBBV C values range from 0.10 to 0.25, clearly exceeding the threshold value. A second challenge related to the ultrahigh capacities of these valves is that they may exceed the flow capacity of the test lab.
Attempting to represent the flow capacity of an FBBV in terms of control valve standard methods is confounding and can be very misleading, especially when comparing different ball valve units. Based on the control valve C method, published data suggests that a much bigger FBBV is needed to match the desired capacity of an isolation-type valve. In reality, the two valve types should be the same size.
Engineers specifying FBBVs should ask the supplier how the rated C was determined to make sure they purchase the correct size. While the flow coefficient C has conditional utility, it is important to understand the definition and evaluation methods for this term as presented in the standards. Following are two different approaches to evaluating the flow coefficient of a line size FBBV in the full-open position.
Standards-based method (empirical)
This method is based on actual flow testing of the FBBV according to industry standards. The test method prescribes a test manifold, along with the methods for measuring flow rate and pressure drop to allow direct calculation of the flow coefficient. The test manifold includes the valve and lengths of straight pipe upstream and downstream of the valve. The inlet (P1) pressure is measured two pipe diameters upstream of the valve, and the outlet (P2) pressure is measured at six pipe diameters downstream of the valve.
The flow coefficient at test conditions is calculated from the following equation:
Where Q = volumetric flow rate; GL = liquid specific gravity (water = 1.00); ∆P = pressure differential across the valve; and N1 = units constant (see table 1). Note that the pressure drop used in equation 2 includes the additional losses associated with the eight diameters of straight pipe. This effect is typically minimal for most control valves within the scope of the standard, because the valve produces the dominant loss compared to the piping loss. However, the FBBV is essentially a very short piece of straight pipe, and the test piping losses can actually exceed the losses strictly attributable to the valve in some instances.
Flow model-based method (analytical)
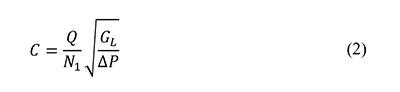
The basis of the analytical approach for computing the flow coefficient C is to start with an estimate of the static head loss coefficient KL associated with the FBBV. The loss coefficient estimate may be as simple as assuming the FBBV behaves as a straight pipe and determining friction losses, or a more complex approach based on using a specific handbook model. An example of the latter is offered by Crane, which suggests using the loss coefficient model:
Where Kbv = velocity head loss coefficient for the ball valve and ƒbv = turbulent pipe friction factor associated with the ball valve. The friction factor may be evaluated from a number of methods and resources but will generally fall in the range of 0.01 to 0.02.
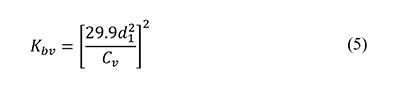
The conversion to flow coefficient C is given by the derived equation
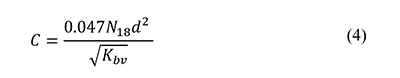
Where d = inside pipe diameter (or in this case ball valve diameter). This analytical method does not include the effects of upstream and downstream test piping integral to the empirical method.
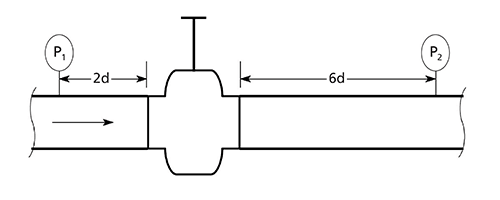
Figure 1. ISA/IEC valve flow test manifold loss model
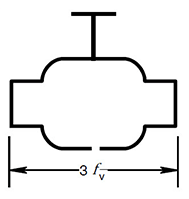
Figure 2. Ball valve loss model
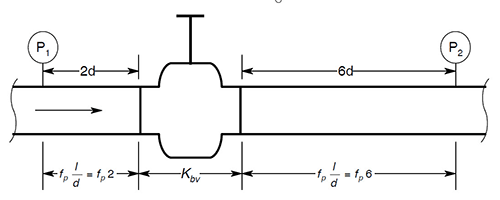
Figure 3. Modified loss model including piping losses
Comparison of methods
To make a meaningful comparison between the two evaluations, the effects of loss from piping must be treated the same in both models. One approach is to use the analytical method, but to employ a modified model that includes the effects of straight pipe as shown in figure 3.
1. Convert reported flow coefficient to a loss coefficient.
Rearranging equation (4):
2. Add line losses. The equivalent loss coefficient for a given length of pipe of is:
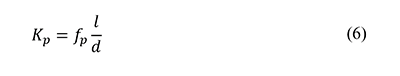
Where l = length of straight pipe; d = inside diameter of pipe; and ƒp = pipe turbulent friction factor.
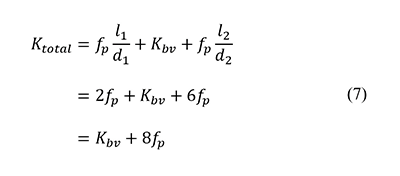
Therefore,
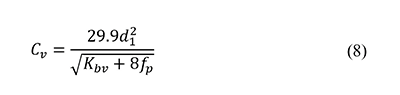
3. Convert back to the flow coefficient. Calculate the revised coefficient based on the total loss:
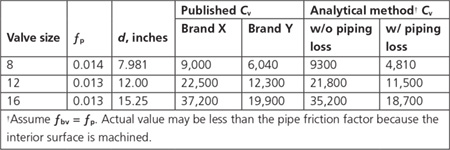
Published Cv values for two different ball valve designs are shown in table 2. Even though the two valves are different brands, the flow paths through them are virtually identical, so the flow coefficients should be nearly equal. However, brand "X" considers only the losses in the valve, so the flow coefficient is considerably larger than brand "Y," which is tested and includes the test manifold piping losses.
Use the analytical adjustments discussed above to make a more meaningful comparison. Flow coefficient values can be estimated considering only the losses in the valve (equation 4). As shown in table 2, these results are a close match to the values for brand "X."
When the analytical piping losses are also considered (equation 8), the resulting capacity is much closer to the tested brand. From this comparison, it can be concluded that even though the published flow coefficient values for these values are very different, they will both pass the same flow rate under the same conditions.
Flow capacity
Representing the flow capacity of full-bore ball valves in the wide-open position presents some challenges. The flow coefficient is very sensitive to whether or not associated test piping frictional losses are included. Published values for different manufacturers may be based on different approaches. To ensure a correct selection, understand how the the valve manufacturer determined the flow coefficient.
Reader Feedback
We want to hear from you! Please send us your comments and questions about this topic to InTechmagazine@isa.org.