

- By Roy Kok
- Web Exclusive
Summary
Today's technologies open the door for reports that drive continuous improvement
By Roy Kok
If you are like most industrial report users, you are being pushed to deliver a report, probably because of some regulation. It can come from the U.S. Environmental Protection Agency, the U.S. Food and Drug Administration, or any of a slew of other agencies or recommenders of best practices.
In many applications, reports are a requirement. We call those compliance reports. It is true of water and wastewater, life sciences, and food and beverage. These and many other markets have quality requirements that demand documentation. Other reports may be for billing purposes or custody transfer, which are common requirements for the power, oil, and gas industries. That demand has been the driving force for the world of industrial report generation since the advent of data logging.
The industrial reporting offerings have been slow to evolve, and there has been little to choose in terms of off-the-shelf product. Consider this, the typical scenario for acquiring a reporting solution: Your market demands a compliance report. But the budget is typically not as important. Why? These reports are mission critical; they are in the direct line of business. In fact, often you cannot be in business without them, and there can be fines if they are not delivered. Getting that report is the focus, so a product or service is selected, and the check box is complete. That result is not the report you really want for running your business, though. The solution that has been implemented generally is not flexible enough or easy enough for anyone but domain experts to use. Your reporting solution gets the initial job done and addresses the key requirement, but at a high expense. And you still need other tools, typically manual data selection and query tools, for additional data visibility and ad hoc analysis.
Automated report generation began in the early 1980s. That is when Lotus 123 and Microsoft Excel were first introduced. One of the first automated solutions for industry was Lotus @Factory in 1991. Automating a spreadsheet became easier in 1993 with the introduction of Microsoft's Component Object Model (COM) technology. Some reporting companies leveraged COM, automated the insertion of data into a workbook, and triggered workbook execution and printing. Other companies created specific solutions for niche industrial applications, but their applicability was narrow and they were cumbersome to apply and maintain. Significant improvements also came in 1991 with the introduction of Crystal Reports. Finally, there was a quality, flexible, and purpose-built reporting solution for business applications. The competition increased in 2004 when Microsoft introduced SQL Server Reporting Services as an add-on to its Microsoft SQL database. Since that time, Crystal Reports and Microsoft SQL Server Reporting Services (SSRS) have dominated the business reporting market. Through the efforts of information technology (IT) professionals and system integrators, they have also been widely applied in the industrial markets, albeit with significant shoehorning to make them fit.
Why would people apply a business-class product in industrial applications? Industrial companies all say, "because we didn't know any better." There is often a follow-on response, "because our IT department is delivering that functionality, and it's the only technology that they know."
So, what are the differences between business and industrial reporting? Understanding this will shed new light on the subject and explain why a purpose-built "industrial" solution is so important.
First, understand that industrial data is fundamentally different from business data. Business reports are typically about lists of information, counts, and dollars and cents. Industrial applications may include all that, but also include devices, such as motors and valves, that are on and off and generate 1s and 0s in a time-series database. There are also common calculations that need to be applied to them, such as run times, cycle counts, and percent utilization.
Other variables can generate incrementing values, like a meter reading. Calculations on meter readings require taking the last value and subtracting the first value for any selected interval, but also require you to pay attention to rollovers. Calculations need to consider when a meter gets to all nines or a programmable logic controller register reaches 16383 or 65535 and starts over. Thermal processes require the monitoring of several sensors to determine when ramp and soak profiles are met, with associated rates of change or soak durations. Analog values are often stored with compression, and returned values are not evenly distributed. Calculations need to be time aware to return the proper values for factors like averages or the integration for totalizations.
Specialty markets have their own calculations-such as those for sterilization processes, thermal storage equivalence, BTU content for fuels, and CO2 production through combustion-and a myriad of other calculations not inherently understood by products designed for business purposes. An industrial product understands the intricacies of dealing with industrial data and removes the burden of customization when attempting to apply business-class solutions.
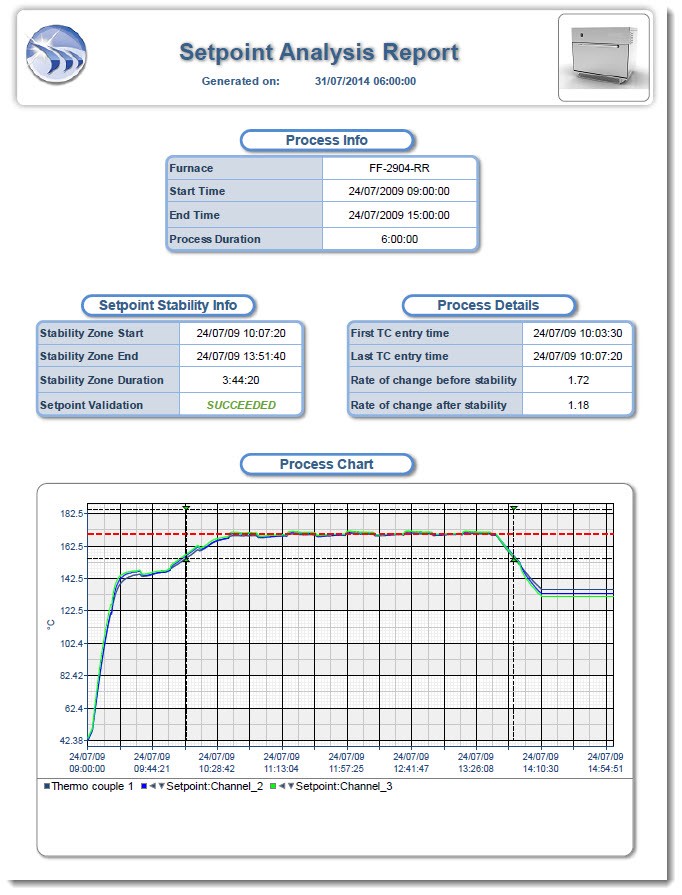
User-configured dashboards provide clear actionable information, as illustrated by this set point analysis report.
Second, industrial data sources have fundamentally different data access methods than those from business data sources. Hundreds of leading industrial automation products offer support for special (generally proprietary) application programming interfaces (APIs) and industrial data access standards. These interfaces usually ensure a level of validation with respect to the date, time, and data being transferred. That validation is commonly referred to as data quality. You know the data is good, because the associated data quality says so. They have proprietary interfaces and support for industrial standards, such as OPC support time, value, and quality (TVQ) data access. However, most automation products also support interfaces common to the business world, typically Open Database Connectivity and the object linking and embedding (OLE) database, enabling very generic access to products, typically business solutions that are unaware of TVQ methods. Business tools can access and perform calculations on automation data, but the results will be far less sophisticated than those of a purpose-built industrial solution.
Also consider that industrial applications make up a very small percentage of the overall reporting market. Business-class products have little reason to adapt to the needs of industry. Only a "built-for-purpose," "industrial" solution will continue to adapt and improve based on the needs of industry.
So far, we have discussed two very technical reasons why a purpose-built industrial report and dashboard solution is fundamentally better than leveraging business technologies for report generation. But there are many more reasons. Take, for example, ease of use. Business tools like Crystal Reports and SQL Server Reporting Services may be easy for IT professionals to use, but they are not easy for process engineers and industrial domain experts. And the customization for "industrial" metrics makes them harder, not easier, to maintain. Process engineers are used to configurable software solutions that are quick to learn and easy to apply. In the 21st century, there is no room for programming, scripting, and extensive system integration. We are in a world of individual empowerment, where everyone should be able to select a tool and create reports and dashboards, without having to write specifications, create justifications, and iterate on the resulting deliverables.
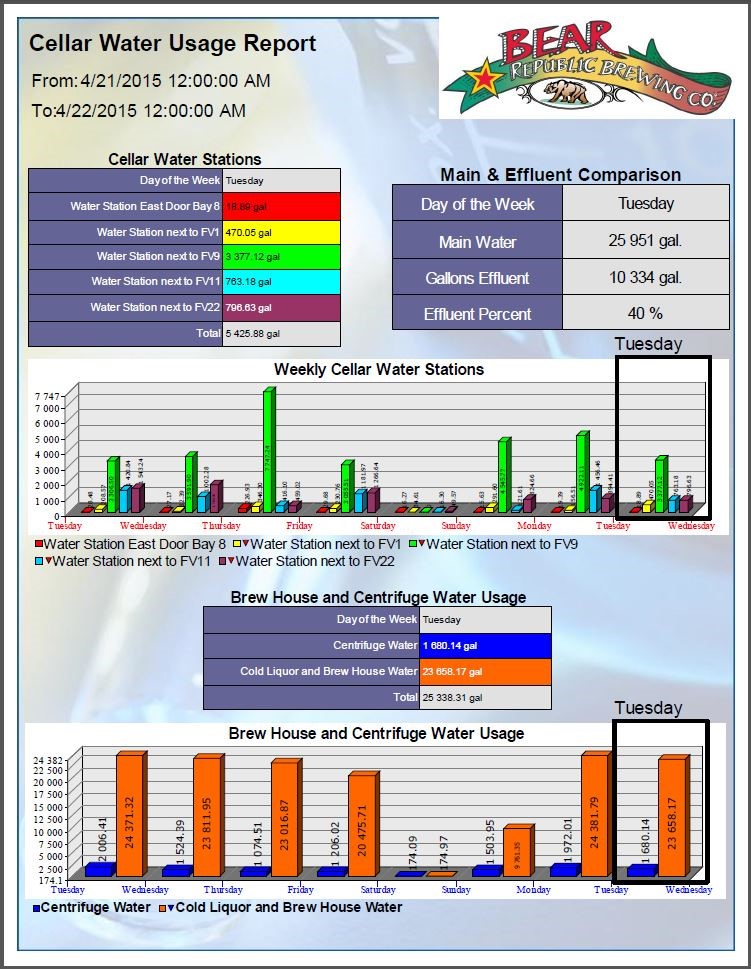
User-configured reports tailor views to improve operations.
Automated reports and dashboards are much more valuable than you realize. While you may have been focused on the business reports that you must have, consider the value in having any report that you would ever want. Increasingly, companies are realizing that reports are an excellent way to share information and drive continuous improvement. These are performance reports, and they have typically been out of reach in the past, due to the lack of ease of use of alternative reporting solutions. Performance reports facilitate collaboration and drive discussion. Generated automatically and distributed via email, FTP, or a browser-based portal, these reports pass knowledge from one shift to the next and help workers understand important key performance indicators (KPIs). Reports are an excellent archival document, letting you revisit historical information and the decisions based on it.

Increasingly, companies are realizing that reports are an excellent way to share information and drive continuous improvement.
Success does not just come from generating and distributing a report. The report needs to be well designed, one that shows your KPIs and places them into context. That is when you have enough information to drive action. Context means surrounding your KPI with comparative information. Do not deliver values in isolation. Compare values from one time to another, year over year, one batch to the next, or to the golden batch.
Adding context will drive action. That action may be as simple as asking the question why. Why is my performance down? Why is my energy utilization higher? Why did that batch take longer? For these questions, you need an information portal. You need to perform some ad hoc analysis around the KPIs in your report. You can simply hyperlink from your report to its browser-based portal, either on a PC or mobile device. Then, drill down into your data, getting to the root causes, and making changes for the better. A report and dashboard solution is complete when it also delivers a "self-service" interface, letting you and your team access, review, and export the data needed to make better decisions.
Casual users often have a hard time relating to data from industrial systems. Data naming conventions (tags) may be cryptic and unorganized. The volume of tags can be unwieldy. Users would benefit greatly from data sources that are organized and that can be filtered, searched, and browsed based on assets, plant areas, or users. Unlike business tools, an industrial solution solves these problems through the ability to create data models. Group and organize your tags in the ways that best support your report development or ad hoc analysis. An industrial solution should also rename tags to make them as user friendly as possible.
Automated reports and dashboards are the ideal solution for creating the detailed statistics and the context required to drive continuous improvement in any application. Although technologies of the past limited reports to the few needed for compliance and regulatory purposes, today's technology makes report and dashboard generation easy and cost effective and enables KPIs to be documented and shared throughout your organization.
Reader Feedback
We want to hear from you! Please send us your comments and questions about this topic to InTechmagazine@isa.org.