

- By Michael Koppelman
- InTech
Summary

By Michael Koppelman
Craft brewing was born of a do-it-yourself (DIY) countercultural mentality that pushed the boundaries of style, brand, and quality beyond accepted norms. Many of the people making craft beer are not process engineers, but instead come from a variety of careers and are looking for a different path. Most have a keen entrepreneurial spirit, an independent streak, and a love of the art of brewing. They come to craft brewing with different motivations, and think differently than many of their counterparts in other industries.
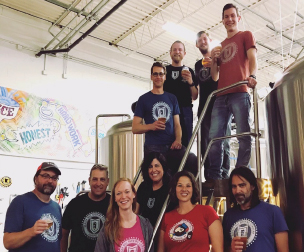
At Badger Hill (figure 1), we enjoy craft brewing because we manufacture fun, making a product that is not a commodity. Our customers want us to be craftspeople-innovative and different-which is exactly what we want to be as a company. Our people understand this, and we are always looking for new ways to improve.
But, craft brewers are also manufacturers. We know we need to deliver product reliably enough to be financially sustainable, which means dealing with many of the same problems as more traditional manufacturers. The expression of the craft and the capital to innovate is made possible through good manufacturing processes. Customers expect consistency, and operations must comply with appropriate regulations. We need to learn from other companies, so we can focus on new problems rather than ones already solved.
This desire for continuous improvement has been a core tenet at Badger Hill since the beginning. Each improvement extends our vision, exposing us to new technologies and applications. When we stir in DIY and Internet of Things (IoT) applications with these technologies, interesting things start to happen.
Some may find it daunting to take risks and experiment with the new IoT and wireless automation technologies, but it is possible to start small and succeed. The sensors and transmitters gathering operational data are the starting point. These technologies are scalable, making it easy to start small and grow.
Rolling our own data historian
Badger Hill does not have a traditional supervisory automation system or a process data historian. Like many craft brewers, ours is largely a manual operation with basic programmable logic controllers driving motors, valves, and pumps-and only a modest amount of instrumentation. When we installed the first wireless pressure transmitter, our initial step was to figure out the best way to extract data and post it to the cloud for analysis and archiving.
This meant getting to know Modbus, an amazingly forward-thinking protocol given its age, which was not familiar to us. Two wires provide remote data access and automation for dozens of devices. It can also be extended transparently over TCP/IP. Our first tests did just that using an industrial wireless gateway that bundled all of the transmitters into a single virtual Modbus network.
As our first experiment, we installed a pressure transmitter on our cold-liquor tank (a brewing water storage tank) to measure the differential pressure (DP) level and post it to the cloud. Given the low cost of cloud storage, we started gathering data continuously.
The data is requested by a simple Modbus master hosted on a $20 Arduino-like chip called a Particle Photon. It reads the response and posts it to a cloud-based database using a RESTful interface over HTTP. For data analytics, we have pretty graphs on the Internet, and we can download the data for analysis. In the future, we would like to tap into the big data capabilities of companies like Google or Amazon. New companies, such as Initial State and Meshify, also exist with this type of application in mind.
We also have Modbus capabilities in our temperature controllers, brewhouse, keg filler, canning line, and centrifuge. We are slowly bringing more data sources into our analysis. Security is and should be a concern, but the cloud is no worse, and probably better, than what can generally be achieved in-house by companies like ours.
Inferring information from data
The interesting part is seeing what information can be inferred from all the data. What can you learn if you are willing to spend some time looking at the data? Inference provides information on behavior, which can relate to a person or a process, and generates four main benefits for Badger Hill:
- self-documents human activities by capturing indications of process steps
- creates information useful for training by illustrating current versus ideal practices
- provides secondary and tertiary information on top of primary functions, useful for risk management
- shows where efficiency can be improved through long-term analysis
What does this all mean in actual practice? How did we recognize the potential, and how have we realized these benefits?
More than just level
The first use of the pressure transmitter was as a DP level instrument on the cold-liquor tank, which is the initial stage for the fresh water to be used for a new batch. In the initial data (figure 2), there was normal data scatter, but in some areas, it was much more pronounced. While this might have been written off as an instrument malfunction, we realized that these areas coincided with feeding steam into the hot-liquor tank heat exchanger.
The cold- and hot-liquor tanks are next to each other and have interconnecting pipes. Heating water in the hot-liquor tank involves feeding steam through a heat exchanger immersed in the water. If too much steam is being fed into the heat exchanger, steam bubbles form in the water, which shake the tank and rattle the piping. This shows up on the pressure transmitter mounted on the cold-liquor tank. So, from this scatter we were able to infer that the steam regulation to the hot-liquor tank heat exchanger was set incorrectly.
This was an interesting realization, but it became clear that much more was possible when looking at more complex operations (figure 3). The process of starting a new batch of beer in the hot-liquor tank follows a set series of steps outlined in the recipe. Usually we try to make two batches, one after the other, over 20 to 25 hours to use energy more efficiently. The hot- and cold-liquor tanks interact as water needs to be heated, and the first batch is cooled by transferring its heat to the second batch. The graph shows the levels on both tanks superimposed with the same time scale. It is easy to see the changes as liquid moves between the two tanks. By following the profile, it is possible to see each step in the process and identify changes. So how do we use this information?
These profiles document each step and put the process in a form suitable for comparing it to similar batches. This provides 90 percent of the information we were recording manually, and provides it in greater detail. When we lay profiles from multiple brewing days on top of each other (figure 4), we can see a high degree of consistency with these manual processes. This suggests we have a good recipe, and our brewers know what they are doing. It also shows us that the process does not need to be adjusted on the fly, which gives us a basis for plans to automate the process. This allows us to build our craft brewers' know-how into our automation.
We manage risk by watching the process in real time. If any values diverge from recognized norms, we know something is going wrong with the batch.
We can use this information for training as we look at the characteristics of the most effective batches and most effective brewers. Positive deviations from normal operations can be captured and analyzed, so we can duplicate improvements.
Making this kind of thing happen is not complex or expensive. It is the result of several technological approaches working together:
- continuously logging critical process variables, with perpetual data retention using the cloud
- data collection and reporting using small, cheap, replaceable devices with powerful capabilities
- strategically placed process instruments
- the ability to recognize when useful information can be inferred from all the data
The lesson for process engineers is that you should not be afraid of looking for valid inferences. These are not guesses if they are informed by the data. Data, by itself, does not help. Information comes from understanding the data and seeing what it is telling you. Insight comes from understanding the information and using it to improve what you are doing to gain competitive advantage.
Reader Feedback
We want to hear from you! Please send us your comments and questions about this topic to InTechmagazine@isa.org.