

- By Michael Risse
- January 30, 2020
- Continuous & Batch Processing
Summary
Fast Forward
- There will be a sweeping transition from historical to predictive analytics.
- There will be an expanded role for subject-matter experts, typically process engineers, in cutting-edge analytics efforts.
- Engineers will quickly create insights to improve outcomes, empowering them to do the right thing.
After years of stagnation come sweeping changes in technologies, users, expectations

By Michael Risse
A new year and decade provide an occasion for predictions regarding the state of analytics in the process industries. After three decades of data generated by digitizing control systems, stored in historians, and imported from ad hoc analytics in spreadsheets, the static and past tense model for analytics is getting long in the tooth. The need for new and improved offerings to actually achieve insights will only become more acute because industry data volumes are accelerating. In fact, industry analyst IDC recently predicted that the average process manufacturing plant will generate and store much more data in 2025 as compared to today (figure 1).
The big data era is far from over; indeed, we are only at the end of the beginning for process industry data volumes, velocity, and variety. This means there will be an even bigger disconnect between the opportunity and reality of advanced analytics in the process industries.
To address the increasing data volumes and close the gap from sensors and data to insights and actions, three key improvements will emerge over the next decade of analytics as the past three decades of the historian/spreadsheet era is left behind. These improvements will be enabled by continuing advances in software and computing technology, the driving force of innovation for the past 30 years. Computing is ever more pervasive, inexpensive, and accessible. The question is, if it was free, what would an organization do with it?
From past to predictive maintenance
The first improvement is a sweeping transition from historical to predictive analytics. Most of the common analytics terms used today reflect a bias toward the past tense. Reports: what happened? Overall equipment effectiveness: what was the equipment effectiveness? Root cause analysis: what caused this? This is historical and backward looking. Certainly, there are exceptions to this view-dashboards and other forms of real-time monitoring for asset performance management (APM) as an example-but most spreadsheet analytics clearly are not a forward-looking exercise.
Further, the use of APM solutions is typically limited by their cost and complexity to expensive, mission-critical assets such as turbines that can justify the resources and keep up with the "drift" in every plant due to changing prices, conditions, formulas, and raw materials. And even dashboards are typically based on a predefined and not dynamic context, and as such report on current data with past tense context.
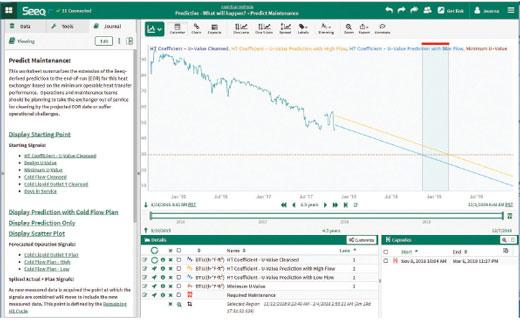
Thus, the future state of analytics is less about the new concept of prediction, and instead more about democratizing this capability. More assets will be involved, ones that certainly could not have been justified in the past due to the expense of sensors, data collection, storage, and traditional APM solutions. Rather than best practices based on a fleet of assets, preventative maintenance will be based on a sample size of one. Broadly deployed, predictive analytics will enable early alerts to avoid incidents, along with other warnings of developing problems, with notice given well in advance. Figure 2 depicts how advanced analytics can be used for predictive analytics.
To realize the benefits of prediction for more and more assets, engineers will move to the forefront of advanced analytics efforts.
Engineers in the lead
The second improvement is an expanded role for subject-matter experts (SMEs), typically process engineers, in cutting-edge analytics efforts. These SMEs have the required education, expertise, and history with the plant and processes: they know what to look for and what it means. "Self-service" or "ad hoc" are the terms used for these types of solutions, which ensure local access to insights by putting the power in the hands of SMEs.
The future state is therefore not replacement of SMEs, which is the message associated with machine learning and initiatives based on information technology (IT), but to instead improve the available tools so they can implement predictive and prescriptive analytics. Although there has been much excitement about data scientists and their role in improving production outcomes, such as the Harvard Business Review's "Sexiest Job of the Century" article back in 2012, more recent articles and anecdotes from end users tell a different story. The fact is, while data scientists know their algorithms, they do not know plant processes and context, or first principles models and how changes affect operations.
There has also been a more recent spate of articles on the need for data translators or data liaisons to work between data science and engineering teams. But all of this can be avoided if advanced analytics vendors simply close the gap and bring data science innovation to SMEs by creating self-service features. Yes, machine learning is a critical component for analytics next, as described in the advanced analytics section below. But although these and other algorithms are important, they are not sufficient. Application-specific expertise is critical and required.
Furthermore, a new generation of analytics cannot end with SMEs. Self-service is what they have been doing for 30 years with spreadsheets. Therefore, new solutions must empower teams and networks of employees to share production and operations insights within the organization. This may just sound like fancy language for dashboards and reports, but there is a critical difference, which is maintaining a connection between the created analysis and the underlying data and providing all users with click through access to this data. Engineers, teams, managers, and organizations can use these new capabilities to distribute benefits throughout a plant and a company.
Insights in time
With more assets connected and contributing to predictive plant maintenance, and tools in the hands of the engineer to participate in innovative plant analytics, the third improvement for the next generation of analytics is to do the right thing. In the context of process manufacturing, the most data intensive and scientific of industries, that may sound ridiculous, but it is a critical difference for future state analytics. Predictive analytics will provide a view into the future, with SMEs and others developing insights in time to impact outcomes.
For example, with spreadsheet-based and other forms of traditional analytics, it often takes longer to do the analysis than the batch takes to complete. This means batches are discarded rather than fixed during the cycle time, so the right thing-finding and fixing the problem during the cycle-does not have a chance to happen. Another example is where there is a question of the right course of action for an asset versus a unit or overall plant objective, where it may be better to postpone a maintenance action to achieve a more important goal, such as continuing production.
A SME should be able to see and identify the trade-offs and make the right decision to optimize overall outcomes. This is transformative analytics: a break from the past tense approach of the long times to insight associated with spreadsheets. In speaking with SMEs, this provides them with ability to do the right thing by quickly examining a given data set with context, data, and priorities as a framework for priorities.
Thus, the end goal of future analytics: enable the right decision in time to improve the outcome. This is why the previous points-a complete view of plant health and requirements and an empowered engineer-are so important. Only with the full context of priorities, costs, and requirements can the right decision be made on a consistent basis. Rather than a "prescriptive" approach that assumes all states, requirements, and outcomes may be defined and known in advance, SMEs and other plant employees can analyze and make decisions in the moment because fast analytics are possible. An example of these concepts is in the sidebar.
Attaining these objectives will be possible, as mentioned earlier, by the continuing innovation in software that has defined every aspect of our personal and professional lives over the past 30 years. Undermining the change are paradigm shifts in where and how analytics will be executed.
Cloud and on-premise edge computing
Analytics workloads are particularly suited for the cloud because most use cases require the scalability, agility, quicker deployment, and lower costs associated with the cloud to analyze more assets and processes. Therefore, companies of all types, including process manufacturers, are moving their IT infrastructure and data to public and hybrid clouds to access on-demand computing resources. And for those companies not willing to move their data to the cloud, the cloud is coming to them in on-premise hardware solutions with cloud platforms, such as AWS Outpost or Microsoft Stack. Process manufacturers will therefore likely use a mix of public and private cloud offerings, as well as on-premise components, for analytics.
The trend is in its infancy, though some industries are ahead in embracing the cloud, for analytics as well as other use cases. Consequently, the big public cloud platforms are paying more attention to the largest sources of data, with manufacturing leading all sectors of the economy in terms of data volumes.
For example, Microsoft, Amazon, and Google have specifically focused on the oil and gas sector as a starting point for their efforts. This is clearly a sign of market interest, and it is also a sign of the maturity of the cloud offerings: Amazon brought out AWS in 2002, and then introduced S3 (storage) and EC2 (virtual machines) in 2006. Cloud computing competition then increased with Microsoft's and Google's cloud platform introductions in 2008.
What this means is that the current model for big data storage in process manufacturing-on premise, historian-based, and proprietary-is undergoing a transition, enabling new alternatives for how and where analytics are run. The new model might be a data lake for data aggregation, on-premise or in the cloud, or a comprehensive Industrial Internet of Things solution, such as a next-generation data storage platform. At a minimum, current process historian vendors need to introduce road maps with safe passage for data from on-premise offerings to the cloud.
Advanced analytics
Spreadsheets lead the way in analytics today, but this general-purpose tool is not suited to the task of implementing predictive and prescriptive analytics. Replacing spreadsheets comes with a new entry to the dictionary: "advanced analytics." Just as adding "smart" to a noun denotes a thing with sensors for telemetry and remote monitoring services (e.g., smart refrigerator, smart parking lot), adding "advanced" to "analytics" brings analytics into a modern framework to address today's challenges.
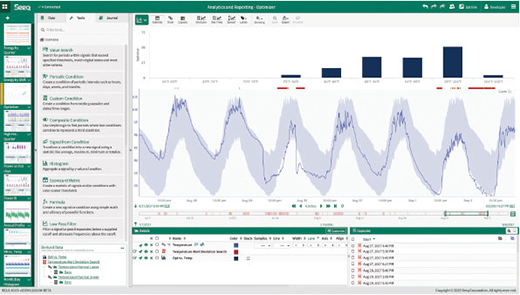
What has happened is that vendors have recognized there is too much data from too many sensors, and potentially of too many types, for one person to simply solve problems manually with a spreadsheet. Therefore, through the introduction of machine learning or other analytics techniques, engineers' efforts are accelerated when seeking correlations, clustering, or any needle within the haystack of process data. With these features built on multidimensional models and enabled by assembling data from different sources, engineers gain an order of magnitude in analytics capabilities, akin to moving from pen and paper to the spreadsheet (figure 3).
Engineer's tool
Advanced analytics innovations are not a black box replacement for the expertise of the engineers, but a complement and accelerator to their expertise, with transparency to the underlying algorithms to support a first principles approach to investigations. It is a natural next step in the history of statistical and control processes, rather than a data science approach to investigations. At the same time, advanced analytics recognizes the path to quicker insights must leverage innovations in adjacent areas to address the scope of data available for investigation.
Wrapping complex functionality in easy-to-use interfaces is a common experience in our lives as consumers, for example, the ability to search in Google. These same approaches are now being adopted by analytics offerings for engineers in process manufacturing.
Looking forward
We are nearing the end of an era defined by on-premise data collection and spreadsheet-based analytics as the next generation of predictive, engineer-led, and timely analytics replaces the status quo. Using advanced analytics, insights will be shared to enable the required collaboration among experts within a single process plant and across an entire organization. These developments will work in concert to advance analytics from backward to forward looking, enabling process plants and facilities to spot developing problems and close control loops.
Predicting sewer spills
Municipalities use wastewater treatment pump or lift stations to keep waste flowing through the system by increasing sewage pressure. Municipalities monitor flow rates to determine if there is too much wastewater at a station, and to see if pumps are cycling too frequently.
When the process goes awry, raw sewage can spill out of manholes or other apertures. A field team can of course be dispatched to clean up the result, but the utility is not always the first to know about the spill. In fact, the first notification of a wastewater spill often comes from a member of the public, hours and sometimes days after the spill.
This can intensify public health and environmental effects and the cost of clean-up efforts, including associated fines. Following a sewage spill at an environmentally significant site, one municipality sought a way to reduce the likelihood and impact of future spills.
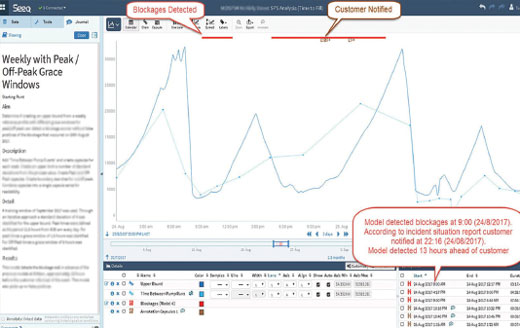
The utility now uses Seeq for an online sewer blockage detection system. The team developed a blockage model based on data from a recent spill, and this model detects blockages much faster than previous methods. With advanced analytics, the model identifies blockages by detecting the absence of “normal fill and pump behavior” in near real time. The absence of pump runs or extended fill time during peak times signifies an abnormality and possible blockage.
The blockage model gives the utility the opportunity to head off spillages, safeguarding the environment while improving public perception. It is also an example of many of the concepts described in this article, including the democratization of assets (predictive analytics on a lowly pump, not a massive turbine), engineer-led solution definition, and access to insights in time to affect outcomes. The figure shows monitoring of the wastewater lift station pump operation to detect blockages in the system, and it shows how repair crews are given sufficient time to correct the problem before an overflow occurs.
Reader Feedback
We want to hear from you! Please send us your comments and questions about this topic to InTechmagazine@isa.org.