

- By Joao Bassa, MSc
- July 31, 2020
- Cover Story
Summary
- Understand the integrated controls systems hierarchy represented by the control pyramid.
- Evaluate automation application development areas, as well as the status of current equipment and technology.
- Combining all this control systems information, plot a graph that can lead to an automation plan.
The fundamentals of evaluating control systems, analyzing the gaps, and plotting a successful course
By Joao Miguel Bassa 
The consistent manufacture of quality products satisfies customer requirements and maintains their confidence. Increased physical plant productivity comes by providing information and tools to the people who manage and operate the facility. Production of quality products in an efficient manner is responsive to the external environment: giving customers products they need, with necessary information about these products, while effectively addressing changes in the marketplace, changes in customers’ requirements, and changes in technology.
A good automation plan comes out of a structured assessment to identify the real status of the production process, as well as the needs, opportunities, and benefits of automation. This article will show you how to perform such an assessment.
The control pyramid
To achieve the objectives, you first need to understand the integrated controls systems hierarchy (figure 1). It shows four layers of controls, with each layer addressing a corresponding decision-making level.
Reflexive controls establish the base layer of the regulatory and sequential controls that directly handle the process inputs and outputs. Reflexive controls maintain the process variables in the specified operation range. Classically, reflexive controls comprise sensors, valves, and the hardware to develop feedback controls, sequential or safety interlocks, indications, and records of the running process. From the old pneumatic instruments to the modern distributed control system (DCS), the main purpose of this layer has not changed; however, the use of the modern smart transmitter in fieldbus arrangements and online analyzers can provide the infrastructure for highest-level (strategic) control-function development and application.
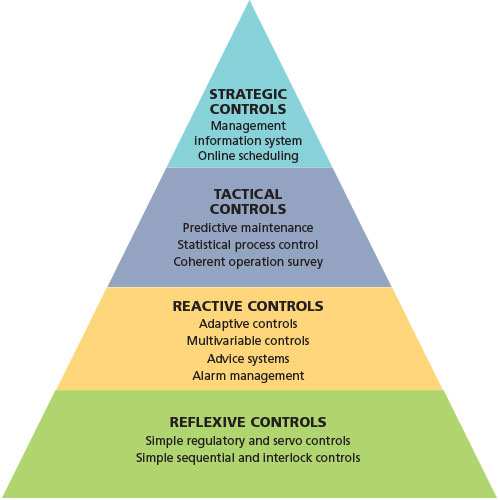
Reactive controls, level two of the pyramid, are intended to improve the reflexive controls. The basic idea is to recognize the variables that can influence each other and create some links, building a complex control loop that can compensate its cyclic interaction (multivariable controls). After the control strategy implementation and again using the data from this first approach about the process model, it is possible to make improvements to automatically change the constraint parameters. In addition, the relational gain between loops can have dynamic changes (nonconventional controls) to obtain the instantaneous best possible relation.
Equally, the same knowledge about the process can be used to develop databases that the operators will use to detect and solve operational problems, like process deviations (specialist advice systems), and the process status recognition can be used to show the operator only the consistent or important alarms related to the actual situation (alarm management systems) of the process.
In the next layer, tactical controls, the local process technical and administrative management is done. In this layer the goal, after the process dynamic model development, is to identify the optimal point to operate the unit concerning the constraints of safety, quality, profitability, and operability. In other words, the objective is to be able to adjust the “set point” for a parameters ensemble, instead of setting the individual variables, which will be set in an optimum correspondence and correlation providing optimization plus operability management (coherent operation survey).
The amount of knowledge about the process and its “behavior,” established at this layer, allows the database improvements developed in the previous layers. This information, allied to the online data from the process, can be used to check, in an “anticipatory” way, the unit operational and safety conditions (statistical process control). Functional diagnostics about the equipment (predictive maintenance interface) can also be produced.
The last step, strategic controls, is intended to provide the link between the process control system and business automation. The goal is to automatically establish the “production set point” (online scheduling) compatible and optimized with the market demand, customer specifications, inventory capacity, business profitability, or some other related data (management information system).
Cost versus benefits across the pyramid
To analyze the pyramid’s different implementation costs, we will split the cost into two different types: hardware-plus-software and engineering. Usually, the main hardware investment will be expended at the beginning of development, to provide installations with the minimum requirements to develop the reflexive controls. This means installing the sensors, valves, and controllers. The hardware investment in the next steps will probably be relatively less expensive, because the development of subsequent steps can take advantage of the control and management system installed potential. In a reciprocal relationship, the engineering costs tend to rise as we advance to the strategic controls, because the process identification and modeling are primarily “man-hour” applications.
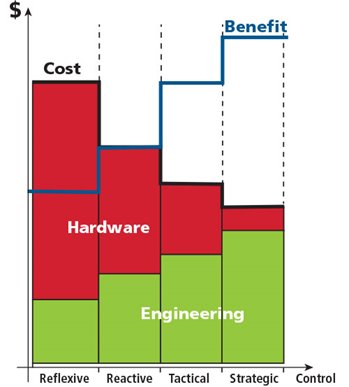
The main benefits of automation will appear at the last stages. This is because, generally, at the beginning steps, we do only what we can also do with conventional instrumentation. Of course, we need to consider factors such as reliability and maintenance costs, which start to be effective after the initial implementation. However, the key benefits, such as optimization and integrated management, which can provide competitive advantage, will appear as we achieve the pyramid upper layer.
Applications and the potential gain
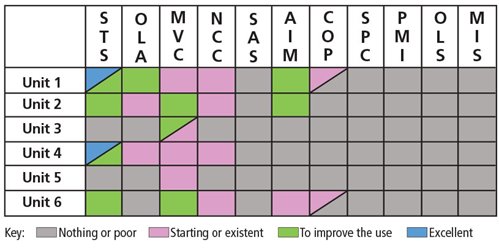
The expected benefit versus cost matrix (figure 3) is a broad overview of control process applications (“costs”) and their relative importance to key business objectives (business “benefits” to be achieved). The potential benefits expected from any of the automation initiatives are listed down the left side of the matrix. Across the top, from left to right, are listed acronyms representing the 11 common automation initiatives that organizations can invest in to deliver those benefits. They include the following:
- Measurement: Smart transmitters/sensors (STS) and online analysis (OLA)
- Control: Multivariable control (MVC) and nonconventional control (NCC)
- Operation support: Specialist advice systems (SAS), alarm information management (AIM), coherent operation survey (COP), and statistical process control (SPC)
- Process interaction: Predictive maintenance interface (PMI), online scheduling (OLS), and management information system (MIS)
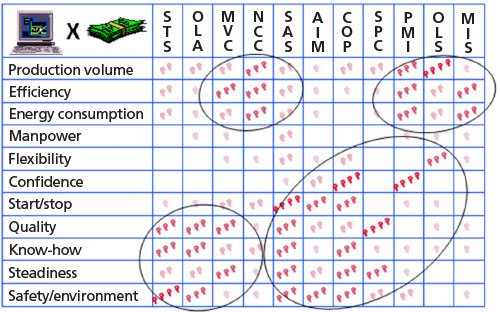
The “grades” in the matrix, represented by the number and color intensity of the dots, are based on general data. Using the matrix, it is possible to identify four main improvement areas, shown by the circles in the illustration, which can come out of process control techniques and specific automation initiatives.
Improvement area one is on the lower left side. Techniques including smart transmitters/sensors, online analysis, and multivariable control provide the gains initially expected: improvements to know-how, quality, and safety.
Improvement area two is shown in the upper middle/left, where implementing multivariable control and nonconventional control makes it possible to reach the first material gains represented by improvements in production, efficiency, and energy consumption.
The operational support techniques of specialist advice systems, alarm information management, coherent operation survey, and statistical process control will increase knowledge and consolidate the process steadiness, as indicated by the lower middle circle.
Finally, the last stage of improvement (upper-right circle) will be based on the knowledge developed from earlier stages. Taking advantage of process interaction techniques, such as predictive maintenance interface, online scheduling, and management information systems, delivers efficiency improvements and increased production volume with less energy consumption.
Assessing the installation’s status
Often, assessment plans need to consider many plant units all together when creating an automation strategic plan. Therefore, a comparison of the status of these units needs to be established. The multi-unit status matrix (figure 4) shows the state of the common automation initiatives from figure 3 in each unit. The conclusion in this example is that we have good reflexive control implementations, plus some reactive and a few tactical control developments. However, much more application and development using the different techniques is needed.
The advantage of having some basic stages developed is that the dynamic models or the related variables can be known, and some applications can be developed.
The general picture shows that, considering only the theoretical side, we have enough basis to improve the reactive controls by consolidating the use of MVC and NCC (except for units 3 and 5 due to the lack of STS and OLA). In addition, the implementation of SAS that can be developed for all units and SPC will produce significant benefits at a relatively low investment (just as an assessment for this specific example).
Hardware evaluation
To avoid an evaluation based only on subjective feelings, you can use six criteria and a weighted formula to classify an installation based on its hardware. Figure 5 shows a hardware evaluation table that uses the six criteria to calculate a hardware technical gap score. In the figure, a 4.0 in the hardware technical gap column indicates the worst technology gap. A 0.0 means up-to-date hardware.
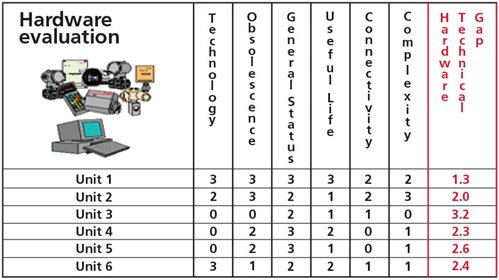
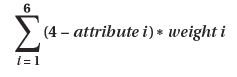
The following attributes are used to build a hardware technical gap score for each installation. The weight of the criteria is shown as a percentage, and a number is associated with each level or type within the criteria. Choose the appropriate number for all criteria for each unit, and then calculate the hardware technical gap using the formula that follows.
- Technology (weight = 5%): 0 – pneumatic, 1 – electronic analog, 2 – hybrid electronic analog/digital, 3 – digital first generation, 4 – digital contemporary
- Obsolescence (weight = 20%): 0 – out of the market, 1 – maintenance still possible, 2 – old/still in the market, 3 – discontinued/supported, 4 – still on the market
- General status (weight = 20%): 0 – old and degenerated, 1 – old and degenerating, 2 – can run, 3 – preserved, 4 – excellent
- Useful life (weight = 30%): 0 – fewer than 3 years, 1 – 3 years to 6 years, 2 – 6 years to 9 years, 3 – 9 years to 12 years, 4 – more than 12 years
- Connectivity (weight =15%): 0 – cannot be connected, 1 – needs communication interface, 2 – proprietary LAN, 3 – Open LAN, 4 – open system network
- Complexity (weight = 10%): 0 – fewer than 50 loops, 1 – 50 to 100 loops, 2 – 100 to 200 loops, 3 – 200 to 300 loops, 4 – more than 300 loops.
The formula used to calculate the hardware technical gap is:
Where we are and where we need to go
Putting together all the above control systems information, it is possible to create an automation strategic plan. You do that by plotting a graph with two dimensions, relating the hardware technical gap score on the vertical axis with the type of controls listed in the control pyramid (figure 6). Different hardware needs levels for each unit, shown as black dots, reflect the actual control systems of today. The more efficient and profitable region of the graph is the upper-right side, representing the most strategic and up-to-date systems.
The purpose of an automation plan is to present the steps needed to reach that upper-right quadrant in the most cost-effective way possible. Figure 6 shows actual control systems (black dots) that are positioned mainly in the graph’s lower-left side. The following creates a plan that divides actions into three phases of improvement.
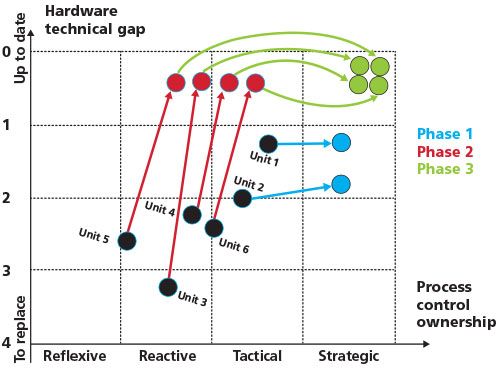
Phase 1: Let’s take advantage of the units that have a lower hardware technical gap (that means the almost modern instrumentation) and promote actions to improve the control system in the strategic controls direction. This will allow organizations to develop knowledge in these applications at a reasonably low cost, because the hardware investment will be reduced.
Phase 2: Once the know-how and benefits of the strategic controls are known, let’s start to modernize the units with the main hardware technical gaps. Of course, these actions will imply bigger investments, but once the final benefits are proved in phase 1, it will be easier to propose and support these investments.
Phase 3: After the units have been modernized and the operation becomes familiar with the new technologies, it is time to again move these units to the strategic controls area.
A good automation plan comes out of a structured assessment to identify the real status and determine the needs, opportunities, and benefits of modernization. An automation plan cannot be proposed just because somebody thinks the control system is old or because there are many people saying that if you do not come to Industry 4.0 you will fail and be out of the market.
Reader Feedback
We want to hear from you! Please send us your comments and questions about this topic to InTechmagazine@isa.org.